All of the World's Money and Markets in One Visualization (2017 Update)

All of the World’s Money and Markets in One Visualization

Enjoy this graphic? You can also find it in our new infographic book – it’s available until Oct 31st, 2017 on Kickstarter.

Millions, billions, and trillions…

When we talk about the giant size of Apple, the fortune of Warren Buffett, or the massive amount of global debt accumulated – all of these things sound large, but they are actually extremely different in magnitude.

That’s why visualizing things spatially can give us a better perspective on money and markets.

How Much Money Exists?

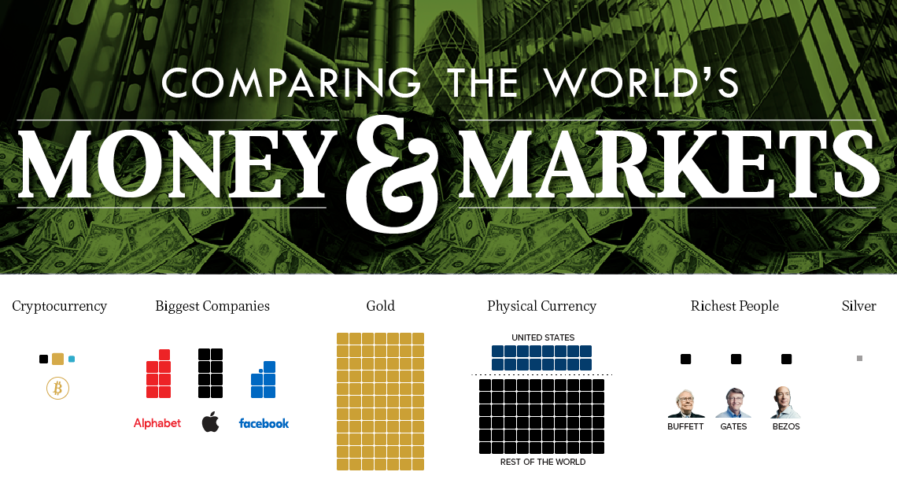
This infographic was initially created to show how much money exists in its different forms. For example, to highlight how much physical cash there is in comparison to broader measures of money which include saving and checking account deposits.

Interestingly, what is considered “money” depends on who you are asking.

Are the abstractions created by Central Banks really money? What about gold, bitcoins, or other hard assets?

A New Meaning

However, since we first released this infographic in 2015, “All the World’s Money and Markets” has taken on a different meaning to us and many others. It’s a way of simplifying a complex universe of currencies, assets, and other financial instruments in a way that people can understand.

Numbers represented in the data visualization range from the size of the above-ground silver market ($17 billion) to the notional value of all derivatives ($1.2 quadrillion as a high-end estimate). In between those two extremes, we’ve added many other familiar measures, such as the GDP of California, the value of equities, the real estate market, along with different money supply metrics to give perspective.

The end result? A visually pleasing, but enlightening new way to understand the vast universe of global assets.

To get “All the World’s Money” in book or poster form, go to the Kickstarter page now. Deadline: Oct. 31, 2017

About the Money Project

The Money Project uses intuitive visualizations to explore ideas around the very concept of money itself. Founded in 2015 by Visual Capitalist and Texas Precious Metals, the Money Project will look at the evolving nature of money, and will try to answer the difficult questions that prevent us from truly understanding the role that money plays in finance, investments, and accumulating wealth.

Presented by:

Also From The Money Project:

What is Money?

The World's Most Famous Case of Hyperinflation

Embed This Image On Your Site (copy code below):

The Money Project is an ongoing collaboration between Visual Capitalist and Texas Precious Metals that seeks to use intuitive visualizations to explore the origins, nature, and use of money.

Bitcoin is no stranger to extreme fluctuations.

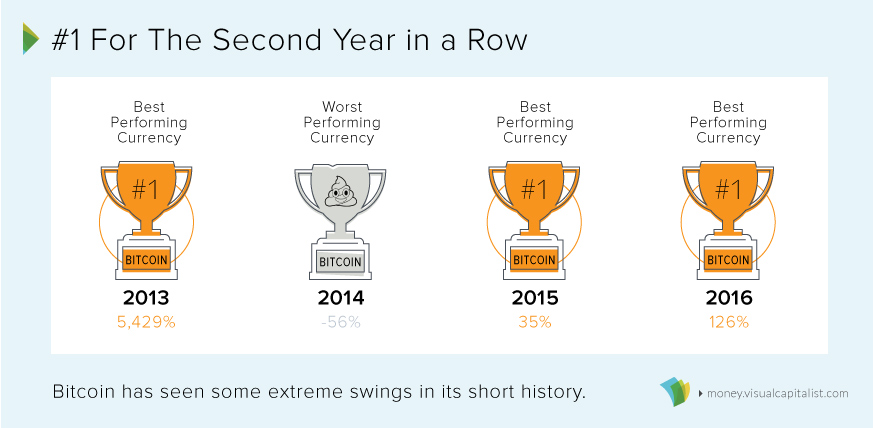
For each of the last four years, the cryptocurrency has either been the best or the worst performing currency – with nothing to be found in between.

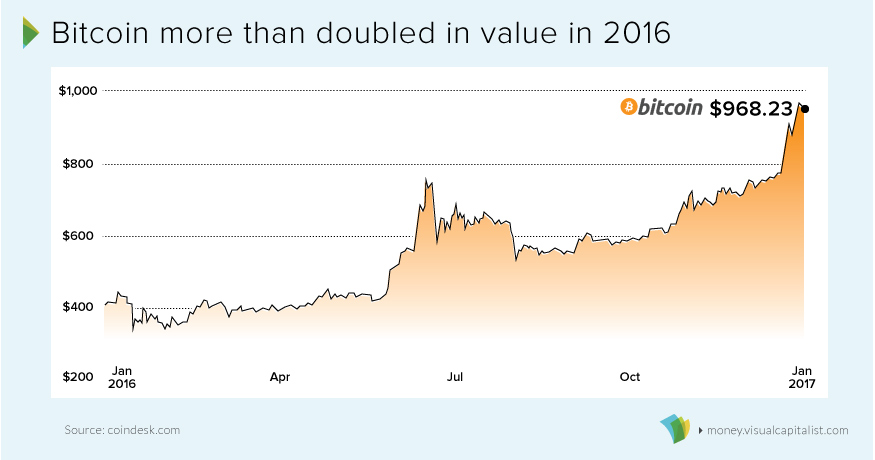
Luckily, for those that follow the digital currency closely, those fluctuations were mostly pointed in an upwards direction for 2016. The currency finished the year at $968.23, which is more than double its value from the beginning of the year.

Bitcoin the best performing currency in 2016

Were any other global currencies able to compete with bitcoin’s strong performance throughout the year?

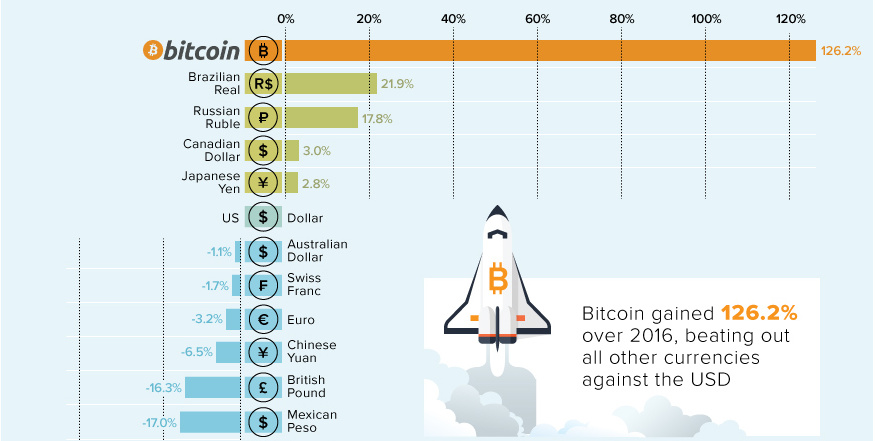
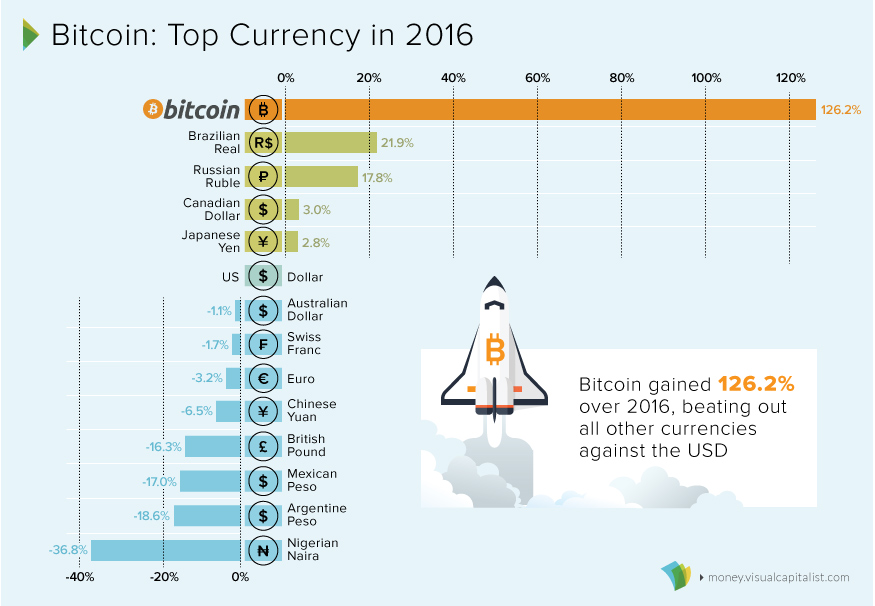
The following chart compares major currencies (paired with the USD) over 2016:

Bitcoin performance vs other currencies

Brazil’s real rallied 21.9% on the year, the most in seven years. Traders are hoping that center-right President Michel Temer can ease public spending following the departure of Dilma Rousseff.

Russia’s ruble also finished the year with double-digit gains, up 17.8% against the U.S. dollar. This was largely due to the recovery in Brent oil prices, which gained $10/bbl over the course of 2016.

However, a rosier picture for oil was not enough to buoy all producers. Africa’s biggest economy, Nigeria, fell into its first recession in 25 years during the opening half of 2016. Ripple effects from low oil prices caused the Nigerian naira to lose more than one-third of its value throughout the year, making it the worst performing currency (at least officially).

Unofficially, Venezuela’s struggling economy has been pushed to the brink by its ongoing currency crisis. The massive hyperinflation is not reflected in official numbers, since the bolívar is technically “pegged” arbitrarily by the government. Based on black market activity, however, experts estimate that the currency ended the year with inflation of roughly 500%.

Bitcoin in 2017?

Bitcoin is now the best performing currency for two years in a row (2015, 2016):

Bitcoin has been the top performer 3 of 4 years

And in the opening days of 2017, the cryptocurrency has already gained a head start on other global currencies. It passed the vital $1,000 mark in the first days of New Year trading, and could be poised to three-peat for the title of best-performing currency of the year.

To do it again, bitcoin prices would likely need to rise at least 30% on the year, closing in on the $1,300 mark.

Will it be another extreme for 2017 – or will the bitcoin price finally settle for middle ground among other global currencies?

It's Official: Bitcoin was the Top Performing Currency of 2015

It’s Official: Bitcoin was the Top Performing Currency of 2015

The Money Project is an ongoing collaboration between Visual Capitalist and Texas Precious Metals that seeks to use intuitive visualizations to explore the origins, nature, and use of money.

For most investors, the major story of 2015 was the expectation and eventual fulfillment of a rate hike, signalling the start of tightening monetary policy in the United States. This policy is divergent to those of other major central banks, and this has translated into considerable strength and momentum for the U.S. dollar.

Using the benchmark of the U.S. Dollar Index, a comparison against a basket of major currencies, the dollar gained 8.3% throughout the year.

Despite this strength, the best performing currency in 2015 was not the dollar. In fact, the top currency of 2015 is likely to be considered the furthest thing from the greenback.

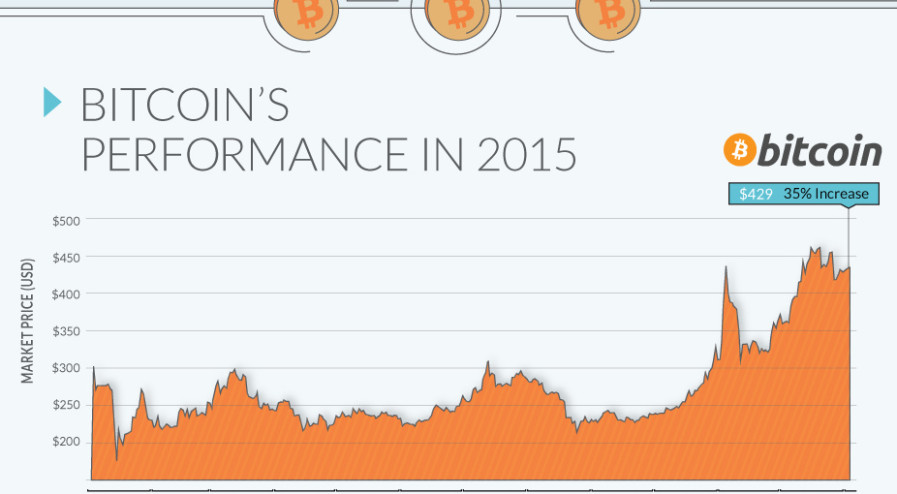
Bitcoin, a digital and decentralized cryptocurrency, staged a late comeback in 2015 to overtake the dollar by a whopping 35% by the end of the year.

Bitcoin is no stranger to extremes. During the year it came into the mainstream in 2013, Bitcoin gained 5,429% to easily surpass all other currencies in gains. However, the following year it would become a dog, losing -56% of its value to become the world’s worst performing currency in 2014.

The second best performing major currency, relative to the USD, was the Israeli shekel. It gained 0.3% throughout the year, and the Japanese yen (0%) and Swiss franc (0%) were close behind, finishing on par with how they started the year.

The world’s worst performing currencies are from countries that were battered by commodities or geopolitical strife.

Ukraine’s hryvnia fell -33.8% in the aftermath of Crimea. Brazil’s real (-30.5%), the Canadian dollar (-15.9%), Russian ruble (-20.8%), and South African rand (-26.7%) all lost significant value in the purging of global commodities. Gold finished the year down -10%, and silver at -11%.

About the Money Project

The Money Project aims to use intuitive visualizations to explore ideas around the very concept of money itself. Founded in 2015 by Visual Capitalist and Texas Precious Metals, the Money Project will look at the evolving nature of money, and will try to answer the difficult questions that prevent us from truly understanding the role that money plays in finance, investments, and accumulating wealth.

Embed This Image On Your Site (copy code below):