38 Incredible Facts on the Modern U.S. Dollar

38 Incredible Facts on the Modern U.S. Dollar

The Money Project is an ongoing collaboration between Visual Capitalist and Texas Precious Metals that seeks to use intuitive visualizations to explore the origins, nature, and use of money.

We’ve previously showed you 31 Fascinating Facts About the Dollar’s Early History, which highlighted the history of U.S. currency before the 20th century. This was a very interesting period in which we looked at the money used by the first colonists, the extreme bust of the Continental currency, the era of privately-issued bank notes, and Congress’ emergency issuance of the fiat “greenback” during the Civil War.

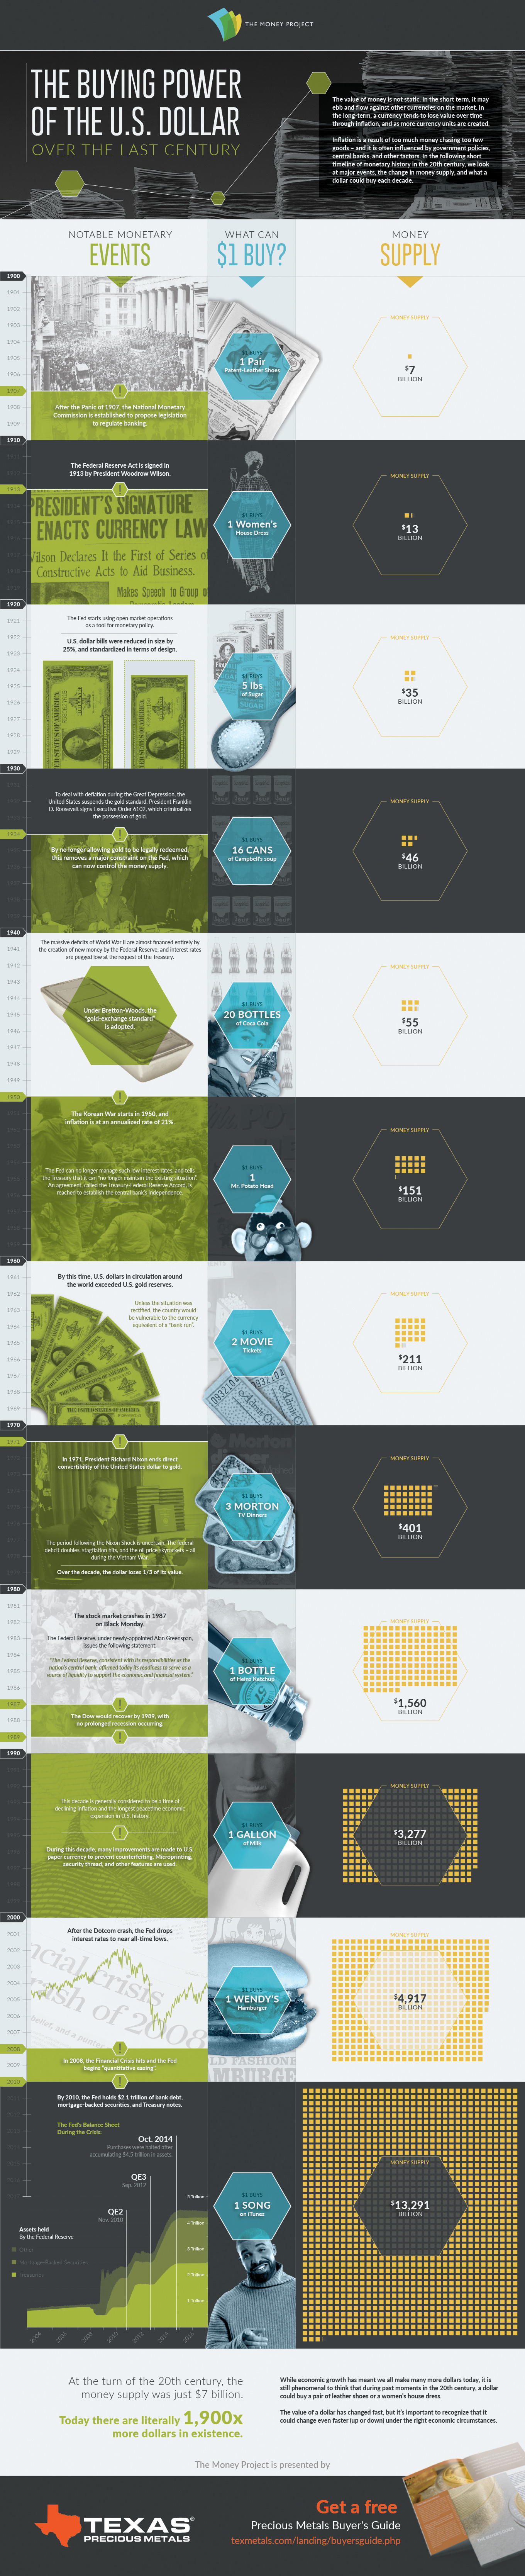
However, the modern era of the U.S. dollar is just as interesting. We have it starting in 1913, when the Federal Reserve Act was passed by Woodrow Wilson. Not only did it establish a new central bank, but it also gave the Fed the authority to issue the Federal Reserve Note, which is now the dominant form of U.S. currency both domestically and abroad.

A New Legal Tender

Leading up to the 20th century, there were four main forms of U.S. currency being used:

  • Gold and silver coins
  • Gold and silver certificates
  • Commercial bank notes, issued by private banks and backed by government bonds
  • “Greenbacks”, a fiat currency declared legal by Congress to help fund the Civil War

In 1913, however, the Federal Reserve Note was authorized as U.S. currency. The new notes were supposed to be backed by gold or other “lawful money”, based on the stipulations of the Federal Reserve Act of 1913.

However, this only lasted about 20 years. By the time of the Great Depression, the Fed considered itself to be in a tight spot. It simply did not have enough gold to back all Federal Reserve Notes and Gold Certificates in circulation, and at the same time wanted flexibility with monetary policy to fight deflation and unemployment.

In 1933, the Emergency Banking Act was passed by President Roosevelt, and Executive Order 6102 was also signed. The latter move famously criminalized monetary gold, and ended the gold standard.

After all, if gold can’t be legally owned, it can’t be legally redeemed.

Modern Paper Money

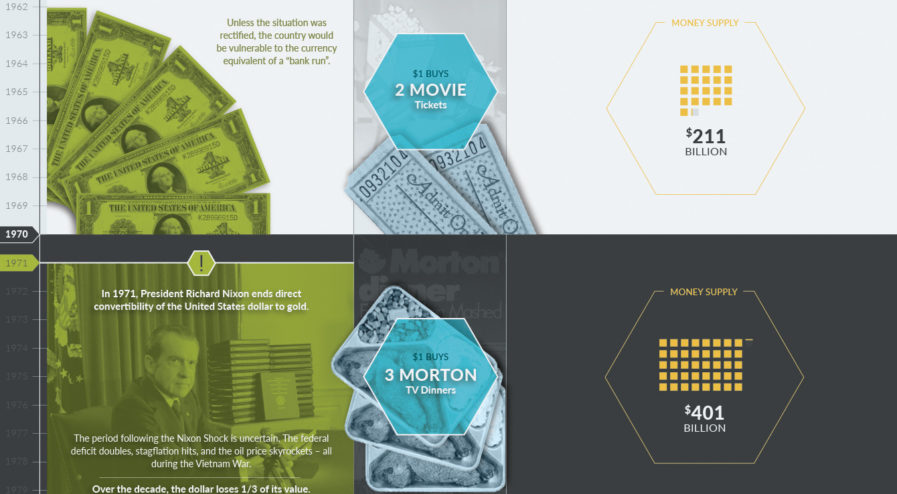
After a brief return to a pseudo gold standard after WWII, Nixon severed all remaining ties between gold and money in 1971. Since then, U.S. money has been purely fiat, and backed by the government rather than any physical commodity or precious metal.

Some facts on today’s paper money:

  • There is $1.54 trillion of U.S. currency in circulation, and 97% of that is Federal Reserve Notes
  • Over two-thirds of all $100 bills are held outside the U.S.
  • Dollar bills can be folded at least 8,000 times, which is 20x more than a normal sheet of paper
  • That’s because dollar bills are made of a special 75% cotton and 25% linen blend, patented by Crane & Co.
  • The U.S. Bureau of Engraving and Printing produces 38 million notes every day, worth $541 million
  • The two facilities, located in Washington, D.C. and Fort Worth, Texas use 9.7 tons of ink per day
  • For 2017, the Fed ordered 7.1 billion new notes, worth $209 billion
  • More than 70% of these notes are used to replace damaged ones
  • Notes with smaller denominations ($1, $5, $10) tend to last for shorter periods of time, due to more frequent usage

Coins

The coins used today are similar to U.S. Federal Reserve Notes in that their face values tend to greatly exceed their intrinsic values.

This is because cheaper metals such as copper, zinc, and nickel are used instead of gold or silver.

  • The average lifespan of a coin is 25 years, according to the U.S. Mint
  • It’s estimated that Americans throw away around $62 million of coins every year
  • In 2016, the U.S. Mint produced 16 trillion coins, valued at over $1.09 billion
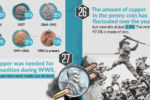
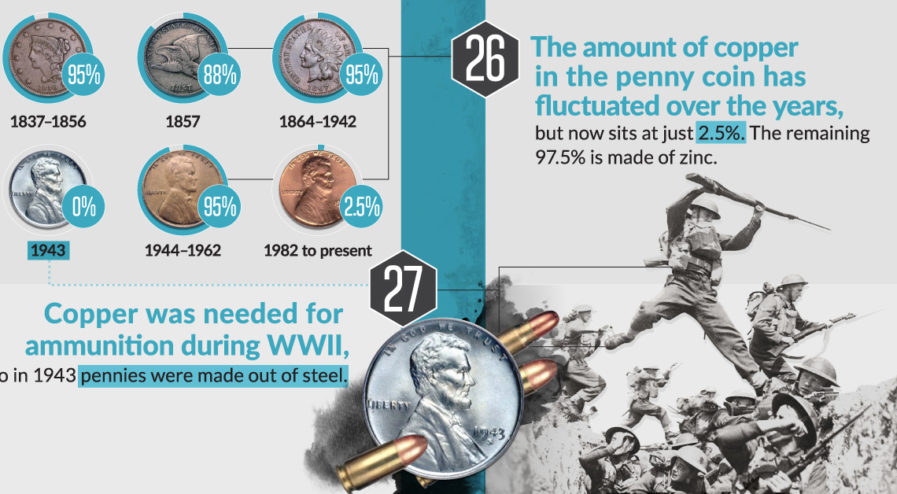
  • The amount of copper in a penny has fluctuated over the years. It ranges from 0% (in WWII, pennies were made of steel so copper could be used for ammunition) to 95%.
  • Today’s pennies are 2.5% copper, with the remainder being 97.5% zinc

Get a free Beginner's Guide to Buying Precious Metals

Embed This Image On Your Site (copy code below):

Presented by: Texas Precious Metals

The Buying Power of the U.S. Dollar Over the Last Century

The Buying Power of the U.S. Dollar Over the Last Century

The Money Project is an ongoing collaboration between Visual Capitalist and Texas Precious Metals that seeks to use intuitive visualizations to explore the origins, nature, and use of money.

The value of money is not static. In the short term, it may ebb and flow against other currencies on the market. In the long-term, a currency tends to lose buying power over time through inflation, and as more currency units are created.

Inflation is a result of too much money chasing too few goods – and it is often influenced by government policies, central banks, and other factors. In this short timeline of monetary history in the 20th century, we look at major events, the change in money supply, and the buying power of the U.S. dollar in each decade.

A Short Timeline of U.S. Monetary History

1900s
After the Panic of 1907, the National Monetary Commission is established to propose legislation to regulate banking.

U.S. Money Supply: $7 billion
What $1 Could Buy: A pair of patent leather shoes.

1910s
The Federal Reserve Act is signed in 1913 by President Woodrow Wilson.

U.S. Money Supply: $13 billion
What $1 Could Buy: A woman’s house dress.

1920s
U.S. dollar bills were reduced in size by 25%, and standardized in terms of design.

The Fed starts using open market operations as a tool for monetary policy.

U.S. Money Supply: $35 billion
What $1 Could Buy: Five pounds of sugar.

1930s
To deal with deflation during the Great Depression, the United States suspends the gold standard. President Franklin D. Roosevelt signs Executive Order 6102, which criminalizes the possession of gold.

By no longer allowing gold to be legally redeemed, this removes a major constraint on the Fed, which can now control the money supply.

U.S. Money Supply: $46 billion
What $1 Could Buy: 16 cans of Campbell’s Soup

1940s
The massive deficits of World War II are almost financed entirely by the creation of new money by the Federal Reserve.

Interest rates are pegged low at the request of the Treasury.

Under Bretton-Woods, the “gold-exchange standard” is adopted.

U.S. Money Supply: $55 billion
What $1 Could Buy: 20 bottles of Coca-Cola

1950s
The Korean War starts in 1950, and inflation is at an annualized rate of 21%.

The Fed can no longer manage such low interest rates, and tells the Treasury that it can “no longer maintain the existing situation”.

U.S. Money Supply: $151 billion
What $1 Could Buy: One Mr. Potato Head

1960s
An agreement, called the Treasury-Federal Reserve Accord, is reached to establish the central bank’s independence.

By this time, U.S. dollars in circulation around the world exceeded U.S. gold reserves. Unless the situation was rectified, the country would be vulnerable to the currency equivalent of a “bank run”.

U.S. Money Supply: $211 billion
What $1 Could Buy: Two movie tickets.

1970s
In 1971, President Richard Nixon ends direct convertibility of the United States dollar to gold.

The period following the Nixon Shock is uncertain. The federal deficit doubles, stagflation hits, and the oil price skyrockets – all during the Vietnam War.

Over the decade, the dollar loses 1/3 of its value.

U.S. Money Supply: $401 billion
What $1 Could Buy: Three Morton TV dinners.

1980s
The stock market crashes in 1987 on Black Monday.

The Federal Reserve, under newly-appointed Alan Greenspan, issues the following statement:

“The Federal Reserve, consistent with its responsibilities as the nation’s central bank, affirmed today its readiness to serve as a source of liquidity to support the economic and financial system.”

The Dow would recover by 1989, with no prolonged recession occurring.

U.S. Money Supply: $1,560 billion
What $1 Could Buy: One bottle of Heinz Ketchup.

1990s
This decade is generally considered to be a time of declining inflation and the longest peacetime economic expansion in U.S. history.

During this decade, many improvements are made to U.S. paper currency to prevent counterfeiting. Microprinting, security thread, and other features are used.

U.S. Money Supply: $3,277 billion
What $1 Could Buy: One gallon of milk.

2000s
After the Dotcom crash, the Fed drops interest rates to near all-time lows.

In 2008, the Financial Crisis hits and the Fed begins “quantitative easing”. Later, this would be known as QE1.

U.S. Money Supply: $4,917 billion
What $1 Could Buy: One Wendy’s hamburger.

2010-
After QE1, the Fed holds $2.1 trillion of bank debt, mortgage-backed securities, and Treasury notes. Shortly after, QE2 starts.

In 2012, it’s time for QE3.

Purchases were halted in October 2014 after accumulating $4.5 trillion in assets.

U.S. Money Supply: $13,291 billion
What $1 Could Buy: One song from iTunes.

The Changing Value of a Dollar

At the turn of the 20th century, the money supply was just $7 billion. Today there are literally 1,900X more dollars in existence.

While economic growth has meant we all make many more dollars today, it is still phenomenal to think that during past moments in the 20th century, a dollar could buy a pair of leather shoes or a women’s house dress.

The buying power of a dollar has changed significantly over the last century, but it’s important to recognize that it could change even faster (up or down) under the right economic circumstances.

Get a free Beginner's Guide to Buying Precious Metals

Embed This Image On Your Site (copy code below):

Presented by: Texas Precious Metals


The Money Project is an ongoing collaboration between Visual Capitalist and Texas Precious Metals that seeks to use intuitive visualizations to explore the origins, nature, and use of money.

Only a few days after Trump’s inauguration ceremony, the U.S. National Debt will creep across the important psychological barrier of $20 trillion.

It’s a problem that’s been passed down to him, but it certainly puts the incoming administration in a difficult place. The debt is burdensome by pretty much any metric, and the rate of borrowing has exceeded economic growth pretty much since the late 1970s.

How Trump deals with this escalating constraint will be a deciding factor in whether his administration crashes and burns – or ends up re-positioning America for greatness.

Donald Trump’s $20 Trillion Problem

Partisans will squabble about who added what to the mounting debt, but the reality is that none of that really matters. Both parties have kicked the can down the road for the last 40 years, and that has culminated in the current situation:
Debt incurred under each President

Back in 1979, the debt-to-GDP ratio was a modest 31.8%, and the federal government only had an outstanding tab of $826 billion. Fast forward to today, and the perpetual borrowing has added up.

The debt-to-GDP is now 104.2%, with the total debt burden nearing the $20 trillion mark.

US government debt to GDP

In absolute terms, the debt is the highest it has ever been. Using the common measure of debt-to-GDP, the debt is the highest it’s been in 70 years. The last time it soared past the 100% mark was during the final year of WWII.

Granted, the situation isn’t as bad as Greece, Cyprus, or Japan – but it’s getting there:

Debt to GDP

In terms of debt-to-revenue, a measure that compares the national debt to the amount of taxes taken in by the federal government, the U.S. has the 2nd highest debt out of 34 OECD countries:

Debt to Revenue

On a “per person” basis, each person in the U.S. owes $61,300 – the second highest in the world. Per taxpayer, however, that amount balloons to $167,000.

Changing Rhetoric

So what does Trump think of all this debt business? It’s hard to say, because his rhetoric has changed.

At the start of his campaign, he made it clear that debt would be a top issue for his administration. In February 2016, Trump said that the U.S. was becoming a “large-scale version of Greece” and that tackling the debt would be “easy” with a more dynamic economy. In April 2016, he said he could pay off the debt after eight years in office.

This rhetoric aligns with the official GOP platform, which says that the national debt has “placed a significant burden on future generations”, calling for a “strong economy” and “spending restraint” to pay it down.

But since then, Trump’s views may have changed.

His most recent economic plans include $1 trillion in infrastructure and $5 trillion in tax cuts – and they could increase debt by anywhere from $5.3 to $11.5 trillion. He’s also said that the U.S. will never have to default because it can simply “print money”.

How Trump will choose to deal with the debt is a big question – and only time will tell if his actions will make America great again.

About the Money Project

The Money Project aims to use intuitive visualizations to explore ideas around the very concept of money itself. Founded in 2015 by Visual Capitalist and Texas Precious Metals, the Money Project will look at the evolving nature of money, and will try to answer the difficult questions that prevent us from truly understanding the role that money plays in finance, investments, and accumulating wealth.

Presented by: Texas Precious Metals

Visualizing the Size of the U.S. National Debt

Visualizing the Size of the U.S. National Debt

The Money Project is an ongoing collaboration between Visual Capitalist and Texas Precious Metals that seeks to use intuitive visualizations to explore the origins, nature, and use of money.

When numbers get into the billions or trillions, they start to lose context.

The U.S. national debt is one of those numbers. It currently sits at $19.5 trillion, which is actually such a large number that it is truly difficult for the average person to comprehend.

How big is the U.S. National Debt?

The best way to understand these large numbers? We believe it is to represent them visually, by plotting the data with comparable numbers that are easier to grasp.

Today’s data visualization plots the U.S. National Debt against everything from the assets managed by the world’s largest money managers, to the annual value of gold production.

1. The U.S. national debt is larger than the 500 largest public companies in America.
The S&P 500 is a stock market index that tracks the value of the 500 largest U.S. companies by market capitalization. It includes giant companies like Apple, Exxon Mobil, Microsoft, Alphabet, Facebook, Johnson & Johnson, and many others. In summer of 2016, the value of all of these 500 companies together added to $19.1 trillion – just short of the debt total.

2. The U.S. national debt is larger than all assets managed by the world’s top seven money managers.
The world’s largest money managers – companies like Blackrock, Vanguard, or Fidelity – manage trillions of investor assets in stocks, bonds, mutual funds, ETFs, and more. However, if we take the top seven of these companies and add all of their assets under management (AUM) together, it adds up to only $18.9 trillion.

3. The U.S. national debt is 25x larger than all global oil exports in 2015.
Yes, countries such as Saudi Arabia, Kuwait, and Russia make a killing off of selling their oil around the world. However, the numbers behind these exports are paltry in comparison to the debt. For example, you’d need the Saudis to donate the next 146 years of revenue from their oil exports to fully pay down the debt.

4. The U.S. national debt is 155x larger than all gold mined globally in a year.
Gold has symbolized money and wealth for a long time – but even the world’s annual production of roughly 3,000 tonnes (96 million oz) of the yellow metal barely puts a dent in the debt total. At market prices today, you’d need to somehow mine 155 years worth of gold at today’s rate to equal the debt.

5. In fact, the national debt is larger than all of the world’s physical currency, gold, silver, and bitcoin combined.
That’s right, if you rounded up every single dollar, euro, yen, pound, yuan, and any other global physical currency note or coin in existence, it only amounts to a measly $5 trillion. Adding the world’s physical gold ($7.7 trillion), silver ($20 billion), and cryptocurrencies ($11 billion) on top of that, you get to a total of $12.73 trillion. That’s equal to about 65% of the U.S. national debt.

Get a free Beginner's Guide to Buying Precious Metals

Embed This Image On Your Site (copy code below):

The World's Most Famous Case of Deflation (Part 1 of 2)

The World’s Most Famous Case of Deflation (Part 1 of 2)

The Money Project is an ongoing collaboration between Visual Capitalist and Texas Precious Metals that seeks to use intuitive visualizations to explore the origins, nature, and use of money.

The Great Depression was the most severe economic depression ever experienced by the Western world.

It was during this troubled time that the world’s most famous case of deflation also happened. The resulting aftermath was so bad that economic policy since has been chiefly designed to prevent deflation at all costs.

Setting the Stage

The transition from wartime to peacetime created a bumpy economic road after World War I.

Growth has hard to come by in the first years after the war, and by 1920-21 the economy fell into a brief deflationary depression. Prices dropped -18%, and unemployment jumped up to 11.7% in 1921.

However, the troubles wouldn’t last. During the “Roaring Twenties”, economic growth picked up as the new technologies like the automobile, household appliances, and other mass-produced products led to a vibrant consumer culture and growth in the economy.

More than half of the automobiles in the nation were sold on credit by the end of the 1920s. Consumer debt more than doubled during the decade.

While GDP growth during this period was extremely strong, the Roaring Twenties also had a dark side. Income inequality during this era was the highest in American history. By 1929, the income of the top 1% had increased by 75%. Income for the rest of people (99%) increased by only 9%.

The Roaring Twenties ended with a bang. On Black Thursday (Oct 24, 1929), the Dow Jones Industrial Average plunged 11% at the open in very heavy volume, precipitating the Wall Street crash of 1929 and the subsequent Great Depression of the 1930s.

The Cause of the Great Depression

Economists continue to debate to this day on the cause of the Great Depression. Here’s perspectives from three different economic schools:

Keynesian:

John Maynard Keynes saw the causes of the Great Depression hinge upon a lack of aggregate demand. This later became the subject of his most influential work, The General Theory of Employment, Interest, and Money, which was published in 1936.

Keynes argued that the solution was to stimulate the economy through some combination of two approaches:
1. A reduction in interest rates (monetary policy), and
2. Government investment in infrastructure (fiscal policy).

“The difficulty lies not so much in developing new ideas as in escaping from old ones.” – John Maynard Keynes

Monetarist:

Monetarists such as Milton Friedman viewed the cause of the Great Depression as a fall in the money supply.

Friedman and Schwartz argue that people wanted to hold more money than the Federal Reserve was supplying. As a result, people hoarded money by consuming less. This caused a contraction in employment and production since prices were not flexible enough to immediately fall.

“The Great Depression, like most other periods of severe unemployment, was produced by government mismanagement rather than by any inherent instability of the private economy.” ― Milton Friedman

Austrian:

Austrian economists argue that the Great Depression was the inevitable outcome of the monetary policies of the Federal Reserve during the 1920s.

In their opinion, the central bank’s policy was an “easy credit policy” which led to an unsustainable credit-driven boom.

“Any increase in the relative size of government in the economy, therefore, shifts the societal consumption-investment ratio in favor of consumption, and prolongs the depression.” – Murray Rothbard

The Great Depression and Deflation

Between 1929 and 1932, worldwide GDP fell by an estimated 15%.

Deflation hit.

Personal income, tax revenue, profits and prices plunged. International trade fell by more than 50%. Unemployment in the U.S. rose to 25% and in some countries rose as high as 33%.

These statistics were only the tip of the iceberg. Learn about the full effects, the stories, and the recovery from the Great Depression in Part 2.

About the Money Project

The Money Project aims to use intuitive visualizations to explore ideas around the very concept of money itself. Founded in 2015 by Visual Capitalist and Texas Precious Metals, the Money Project will look at the evolving nature of money, and will try to answer the difficult questions that prevent us from truly understanding the role that money plays in finance, investments, and accumulating wealth.

Embed This Image On Your Site (copy code below):