Presented by: Texas Precious Metals

From the 10 years of military dictatorship between 1948-1958 to the impeachment of Carlos Andrés Pérez for corruption in 1993, Venezuelan politics have often been both rocky and eventful.

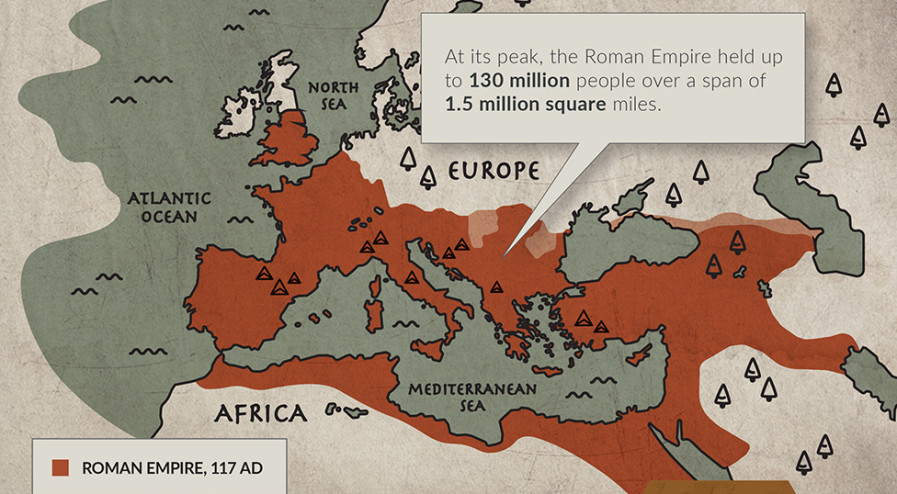
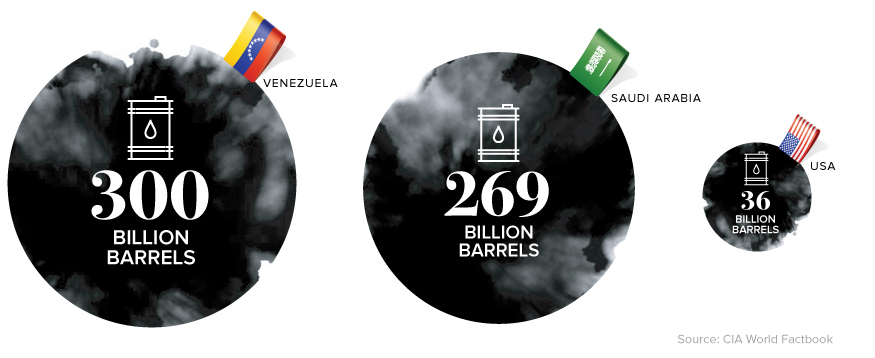
But despite these challenges throughout its history, no one has ever denied Venezuela’s economic potential. After the discovery of oil in the early 20th century, the nation quickly built its economy on back of black gold – and even today, Venezuela leads the world in proven oil reserves with 300 billion barrels.

Oil reserves Venezuela

Early on, Venezuela’s oil was a game-changer.

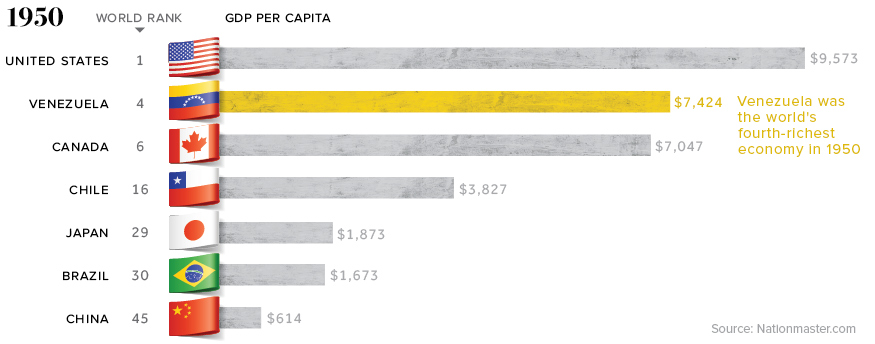
By 1950, as the rest of the world was struggling to recover from World War II, Venezuela had the fourth-richest GDP per capita on Earth. The country was 2x richer than Chile, 4x richer than Japan, and 12x richer than China!

1950 GDP per capita rates

Unfortunately for Venezuela, this wealth wouldn’t last – and an over-reliance on oil would soon decimate the economy in unexpected ways.

The Downfall of Venezuela’s Economy

From 1950 to the early 1980s, the Venezuelan economy experienced steady growth.

By 1982, Venezuela was still the richest major economy in Latin America. The country used its vast oil wealth to pay for social programs, including health care, education, transport, and food subsidies. Workers in Venezuela were among the highest paid in the region.

However, as you’ll see in the following animation, from there things went quickly downhill. In the mid-1980s, an oil glut and a free-falling oil price ended up decimating the Venezuelan economy, which was unable to diversify away from energy.

Venezuela GDP per capita

Today, Venezuela has one of the poorest major economies in Latin America – and as the current crisis rides itself out, the IMF foresees it getting far worse. By 2022, the organization predicts Venezuela’s GDP per capita (PPP) will be just $12,210, which would be a massive economic setback – the Venezuelan economy would be even poorer than it was many years before the Chávez era started.

Flying Too Close to the Sun

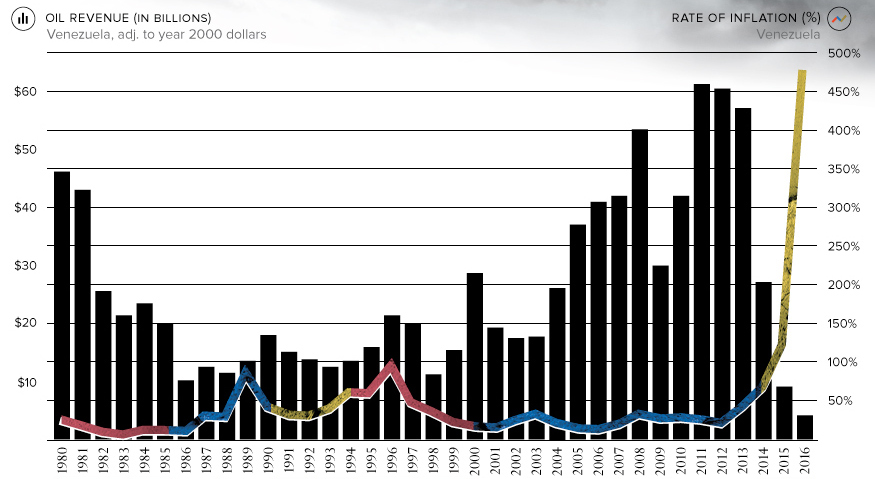
Although oil revenues are tempting to rely on to maintain social order, they come with a degree of unpredictability. According to OPEC, Venezuela still relies on oil for 95% of its exports, which means that any fluctuations in oil price can be the difference between immense wealth and near-poverty.

Venezuela inflation vs. oil revenues

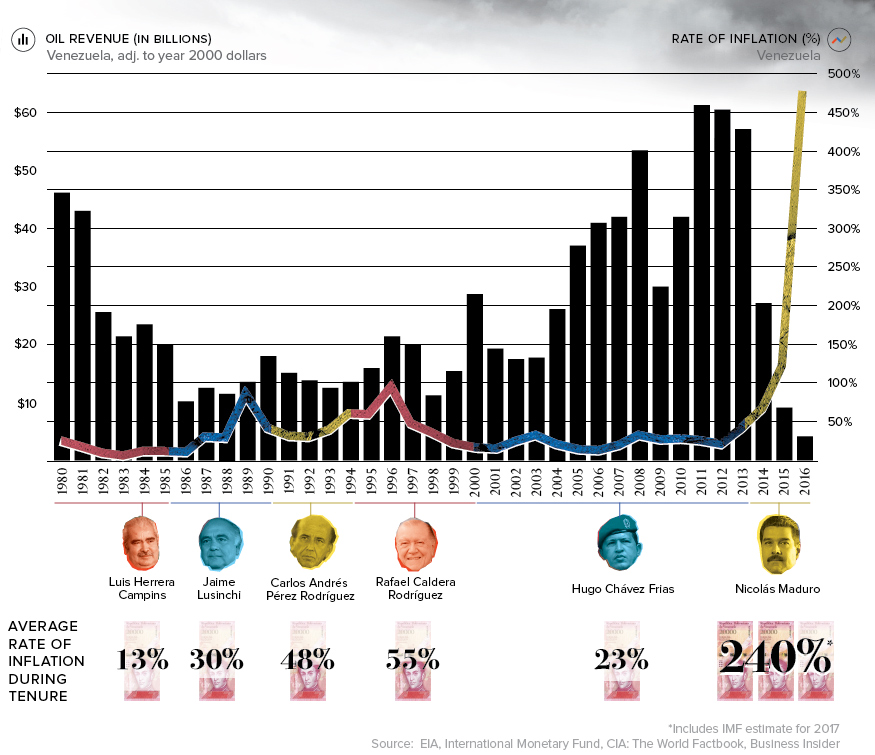
The above graphic shows Venezuela’s oil revenues (in 2000 dollars) against the rate of inflation – and it symbolizes the story of Venezuela’s recent economic history as succinctly as possible.

After the oil glut in the 1980s, Venezuela’s oil revenues dropped significantly. It was then that Venezuela had its first bout with inflation, where rates peaked in 1989 (84.5% inflation) and later in 1996 (99.9% inflation). Without sufficient money coming in, the country had to rely on its printing presses in an attempt to maintain living standards.

In 1998, Hugo Chávez was elected with the promise that Venezuela could reduce poverty and step up living standards by leaning even more heavily on its energy wealth. The recovery of oil prices helped this come true in the 2000s, and Chávez later passed away in office in 2013.

A Temporary Fix

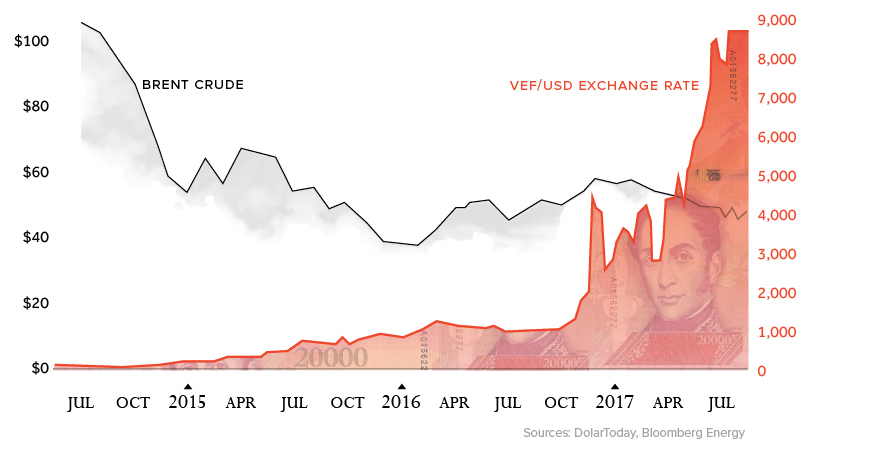
Nicolás Maduro, who took over after the death of his predecessor, saw oil prices crash almost immediately, and it was clear that Venezuela’s intense battle with inflation was only just beginning. The national currency, the Venezuelan bolívar, would soon be almost worthless.

Bolivar inflation against USD

The details of today’s crisis and intense hyperinflation are widely shared.

The country has massive shortages of food, electricity, and other essential goods, and violence is escalating in Caracas. More recently, the government is attempting to tighten its grip around power, and mismanagement of the economy has led to people starving on the streets. People are calling the situation a humanitarian crisis, which is extremely disheartening to see in what was once one of the richest countries on the planet.

And while the current condition of Venezuela is a tragedy in itself, the country’s inability to live up to its true economic potential is nearly just as devastating.

The Money Project

The Money Project is an ongoing collaboration between Visual Capitalist and Texas Precious Metals that seeks to use intuitive visualizations to explore the origins, nature, and use of money.

Get a free Beginner's Guide to Buying Precious Metals

38 Incredible Facts on the Modern U.S. Dollar

38 Incredible Facts on the Modern U.S. Dollar

The Money Project is an ongoing collaboration between Visual Capitalist and Texas Precious Metals that seeks to use intuitive visualizations to explore the origins, nature, and use of money.

We’ve previously showed you 31 Fascinating Facts About the Dollar’s Early History, which highlighted the history of U.S. currency before the 20th century. This was a very interesting period in which we looked at the money used by the first colonists, the extreme bust of the Continental currency, the era of privately-issued bank notes, and Congress’ emergency issuance of the fiat “greenback” during the Civil War.

However, the modern era of the U.S. dollar is just as interesting. We have it starting in 1913, when the Federal Reserve Act was passed by Woodrow Wilson. Not only did it establish a new central bank, but it also gave the Fed the authority to issue the Federal Reserve Note, which is now the dominant form of U.S. currency both domestically and abroad.

A New Legal Tender

Leading up to the 20th century, there were four main forms of U.S. currency being used:

  • Gold and silver coins
  • Gold and silver certificates
  • Commercial bank notes, issued by private banks and backed by government bonds
  • “Greenbacks”, a fiat currency declared legal by Congress to help fund the Civil War

In 1913, however, the Federal Reserve Note was authorized as U.S. currency. The new notes were supposed to be backed by gold or other “lawful money”, based on the stipulations of the Federal Reserve Act of 1913.

However, this only lasted about 20 years. By the time of the Great Depression, the Fed considered itself to be in a tight spot. It simply did not have enough gold to back all Federal Reserve Notes and Gold Certificates in circulation, and at the same time wanted flexibility with monetary policy to fight deflation and unemployment.

In 1933, the Emergency Banking Act was passed by President Roosevelt, and Executive Order 6102 was also signed. The latter move famously criminalized monetary gold, and ended the gold standard.

After all, if gold can’t be legally owned, it can’t be legally redeemed.

Modern Paper Money

After a brief return to a pseudo gold standard after WWII, Nixon severed all remaining ties between gold and money in 1971. Since then, U.S. money has been purely fiat, and backed by the government rather than any physical commodity or precious metal.

Some facts on today’s paper money:

  • There is $1.54 trillion of U.S. currency in circulation, and 97% of that is Federal Reserve Notes
  • Over two-thirds of all $100 bills are held outside the U.S.
  • Dollar bills can be folded at least 8,000 times, which is 20x more than a normal sheet of paper
  • That’s because dollar bills are made of a special 75% cotton and 25% linen blend, patented by Crane & Co.
  • The U.S. Bureau of Engraving and Printing produces 38 million notes every day, worth $541 million
  • The two facilities, located in Washington, D.C. and Fort Worth, Texas use 9.7 tons of ink per day
  • For 2017, the Fed ordered 7.1 billion new notes, worth $209 billion
  • More than 70% of these notes are used to replace damaged ones
  • Notes with smaller denominations ($1, $5, $10) tend to last for shorter periods of time, due to more frequent usage

Coins

The coins used today are similar to U.S. Federal Reserve Notes in that their face values tend to greatly exceed their intrinsic values.

This is because cheaper metals such as copper, zinc, and nickel are used instead of gold or silver.

  • The average lifespan of a coin is 25 years, according to the U.S. Mint
  • It’s estimated that Americans throw away around $62 million of coins every year
  • In 2016, the U.S. Mint produced 16 trillion coins, valued at over $1.09 billion
  • The amount of copper in a penny has fluctuated over the years. It ranges from 0% (in WWII, pennies were made of steel so copper could be used for ammunition) to 95%.
  • Today’s pennies are 2.5% copper, with the remainder being 97.5% zinc

Get a free Beginner's Guide to Buying Precious Metals

Embed This Image On Your Site (copy code below):

Presented by: Texas Precious Metals

Although gold has a bigger reputation today as a monetary metal, it was often deemed too valuable for everyday transactions throughout history.

For the most part, common people in places like Ancient Rome used silver to buy daily staples like grain or wine. As a result, silver has a strong reputation through monetary history as the “people’s money”.

Even today, silver is still much more widely accessible. With one ounce of gold being 70x more expensive than an ounce of silver, it’s difficult for someone who is just starting to accumulate wealth to own gold.

Visualizing Silver

What do savings and debt look like, using the “people’s money”?

Below is everything from the average paycheck to global sovereign debt visualized as silver cubes.

1. A median U.S. family brings in $2,355 per pay period (semi-monthly) pre-tax.

Average U.S. Paycheck as a Silver Cube

2. However, the median American family only has about $5,000 of savings.

Median U.S. Savings as a Silver Cube

3. The standard silver delivery bar holds 1,000 oz of silver.

Silver bar

4. Average household debt is $98,312, with mortgage debt being the primary component.

Average household debt as a silver cube

5. A Lamborghini worth over $400,000 needs a silver cube with 16-inch (0.4m) sides.

A Lamborghini's value as a silver cube

6. Using a silver price of about $18/oz, here’s what $1 million looks like.

$1 million as a silver cube

7. Every day, the world’s mines produce about 75 tonnes of silver, worth over $44 million.

Daily Silver Production as a silver cube

8. Silver Eagle sales have jumped considerably since the Financial Crisis.

Silver Eagle Sales as a Silver Cube

9. When the Hunt Brothers tried to corner the silver market, they hoarded 200 million oz.

Hunt Brothers Stockpile as a Silver Cube

10. Today, almost 900 million oz of silver is mined each year.

All Silver Mined Each Year as a Silver Cube

11. JP Morgan’s market capitalization, in comparison to previous cubes.

JPMorgan's market capitalization as a silver cube

12. All silver ever mined would not compare to the Fed’s balance sheet, which is now $4.5 trillion.

All Global Debt Visualized as a Gold Cube

13. Global sovereign debt is 13X bigger than all previous cubes combined.

All Sovereign Debt Visualized as a Gold Cube

Liked our visualizations of silver cubes?

Don’t forget to check out 11 stunning visualizations of gold.

The Money Project is an ongoing collaboration between Visual Capitalist and Texas Precious Metals that seeks to use intuitive visualizations to explore the origins, nature, and use of money.

Get a free Beginner's Guide to Buying Precious Metals

Presented by: Texas Precious Metals

The Global War on Cash

The Global War on Cash

The Money Project is an ongoing collaboration between Visual Capitalist and Texas Precious Metals that seeks to use intuitive visualizations to explore the origins, nature, and use of money.

There is a global push by lawmakers to eliminate the use of physical cash around the world. This movement is often referred to as “The War on Cash”, and there are three major players involved:

1. The Initiators
Who?
Governments, central banks.
Why?
The elimination of cash will make it easier to track all types of transactions – including those made by criminals.

2. The Enemy
Who?
Criminals, terrorists
Why?
Large denominations of bank notes make illegal transactions easier to perform, and increase anonymity.

3. The Crossfire
Who?
Citizens
Why?
The coercive elimination of physical cash will have potential repercussions on the economy and social liberties.

Is Cash Still King?

Cash has always been king – but starting in the late 1990s, the convenience of new technologies have helped make non-cash transactions to become more viable:

  • Online banking
  • Smartphones
  • Payment technologies
  • Encryption

By 2015, there were 426 billion cashless transactions worldwide – a 50% increase from five years before.

Year# of cashless transactions
2010285.2 billion
2015426.3 billion

And today, there are multiple ways to pay digitally, including:

  • Online banking (Visa, Mastercard, Interac)
  • Smartphones (Apple Pay)
  • Intermediaries ( Paypal , Square)
  • Cryptocurrencies (Bitcoin)

The First Shots Fired

The success of these new technologies have prompted lawmakers to posit that all transactions should now be digital.

Here is their case for a cashless society:

Removing high denominations of bills from circulation makes it harder for terrorists, drug dealers, money launderers, and tax evaders.

  • $1 million in $100 bills weighs only one kilogram (2.2 lbs).
  • Criminals move $2 trillion per year around the world each year.
  • The U.S. $100 bill is the most popular note in the world, with 10 billion of them in circulation.

This also gives regulators more control over the economy.

  • More traceable money means higher tax revenues.
  • It means there is a third-party for all transactions.
  • Central banks can dictate interest rates that encourage (or discourage) spending to try to manage inflation. This includes ZIRP or NIRP policies.

Cashless transactions are faster and more efficient.

  • Banks would incur less costs by not having to handle cash.
  • It also makes compliance and reporting easier.
  • The “burden” of cash can be up to 1.5% of GDP, according to some experts.

But for this to be possible, they say that cash – especially large denomination bills – must be eliminated. After all, cash is still used for about 85% of all transactions worldwide.

A Declaration of War

Governments and central banks have moved swiftly in dozens of countries to start eliminating cash.

Some key examples of this? Australia, Singapore, Venezuela, the U.S., and the European Central Bank have all eliminated (or have proposed to eliminate) high denomination notes. Other countries like France, Sweden and Greece have targeted adding restrictions on the size of cash transactions, reducing the amount of ATMs in the countryside, or limiting the amount of cash that can be held outside of the banking system. Finally, some countries have taken things a full step further – South Korea aims to eliminate paper currency in its entirety by 2020.

But right now, the “War on Cash” can’t be mentioned without invoking images of day-long lineups in India. In November 2016, Indian Prime Minister Narendra Modi demonetized 500 and 1000 rupee notes, eliminating 86% of the country’s notes overnight. While Indians could theoretically exchange 500 and 1,000 rupee notes for higher denominations, it was only up to a limit of 4,000 rupees per person. Sums above that had to be routed through a bank account in a country where only 50% of Indians have such access.

The Hindu has reported that there have now been 112 reported deaths associated with the Indian demonetization. Some people have committed suicide, but most deaths come from elderly people waiting in bank queues for hours or days to exchange money.

Caught in the Crossfire

The shots fired by governments to fight its war on cash may have several unintended casualties:

1. Privacy

  • Cashless transactions would always include some intermediary or third-party.
  • Increased government access to personal transactions and records.
  • Certain types of transactions (gambling, etc.) could be barred or frozen by governments.
  • Decentralized cryptocurrency could be an alternative for such transactions

2. Savings

  • Savers could no longer have the individual freedom to store wealth “outside” of the system.
  • Eliminating cash makes negative interest rates (NIRP) a feasible option for policymakers.
  • A cashless society also means all savers would be “on the hook” for bank bail-in scenarios.
  • Savers would have limited abilities to react to extreme monetary events like deflation or inflation.

3. Human Rights

  • Rapid demonetization has violated people’s rights to life and food.
  • In India, removing the 500 and 1,000 rupee notes has caused multiple human tragedies, including patients being denied treatment and people not being able to afford food.
  • Demonetization also hurts people and small businesses that make their livelihoods in the informal sectors of the economy.

4. Cybersecurity

  • With all wealth stored digitally, the potential risk and impact of cybercrime increases.
  • Hacking or identity theft could destroy people’s entire life savings.
  • The cost of online data breaches is already expected to reach $2.1 trillion by 2019, according to Juniper Research.

As the War on Cash accelerates, many shots will be fired. The question is: who will take the majority of the damage?

Get a free Beginner's Guide to Buying Precious Metals

Embed This Image On Your Site (copy code below):

The Money Project is an ongoing collaboration between Visual Capitalist and Texas Precious Metals that seeks to use intuitive visualizations to explore the origins, nature, and use of money.

Bitcoin is no stranger to extreme fluctuations.

For each of the last four years, the cryptocurrency has either been the best or the worst performing currency – with nothing to be found in between.

Luckily, for those that follow the digital currency closely, those fluctuations were mostly pointed in an upwards direction for 2016. The currency finished the year at $968.23, which is more than double its value from the beginning of the year.

Bitcoin the best performing currency in 2016

Were any other global currencies able to compete with bitcoin’s strong performance throughout the year?

The following chart compares major currencies (paired with the USD) over 2016:

Bitcoin performance vs other currencies

Brazil’s real rallied 21.9% on the year, the most in seven years. Traders are hoping that center-right President Michel Temer can ease public spending following the departure of Dilma Rousseff.

Russia’s ruble also finished the year with double-digit gains, up 17.8% against the U.S. dollar. This was largely due to the recovery in Brent oil prices, which gained $10/bbl over the course of 2016.

However, a rosier picture for oil was not enough to buoy all producers. Africa’s biggest economy, Nigeria, fell into its first recession in 25 years during the opening half of 2016. Ripple effects from low oil prices caused the Nigerian naira to lose more than one-third of its value throughout the year, making it the worst performing currency (at least officially).

Unofficially, Venezuela’s struggling economy has been pushed to the brink by its ongoing currency crisis. The massive hyperinflation is not reflected in official numbers, since the bolívar is technically “pegged” arbitrarily by the government. Based on black market activity, however, experts estimate that the currency ended the year with inflation of roughly 500%.

Bitcoin in 2017?

Bitcoin is now the best performing currency for two years in a row (2015, 2016):

Bitcoin has been the top performer 3 of 4 years

And in the opening days of 2017, the cryptocurrency has already gained a head start on other global currencies. It passed the vital $1,000 mark in the first days of New Year trading, and could be poised to three-peat for the title of best-performing currency of the year.

To do it again, bitcoin prices would likely need to rise at least 30% on the year, closing in on the $1,300 mark.

Will it be another extreme for 2017 – or will the bitcoin price finally settle for middle ground among other global currencies?

Presented by: Texas Precious Metals

Demystifying the Chinese Yuan

Demystifying the Chinese Yuan

The Money Project is an ongoing collaboration between Visual Capitalist and Texas Precious Metals that seeks to use intuitive visualizations to explore the origins, nature, and use of money.

With one of the world’s largest economies and a growing financial sector, China continues to rise as a global power.

The country’s currency, the Chinese yuan (officially the Renminbi), is also starting to mature. The most recent evidence of this? The IMF’s decision to include the yuan as a part of its SDR international reserve asset, a basket of major world currencies:

Currency2011-2015 SDR2016 SDRChange
U.S. Dollar41.9%41.7%-0.2%
Euro37.4%30.9%-6.5%
Pound11.3%8.1%-3.2%
Yen9.4%8.3%-1.1%
Yuan0.0%10.9%+10.9%

The Chinese economy is significant on a world stage, but its currency and financial system still have major growing up to do.

China is walking a fine balance: it desperately wants to legitimize its currency, but it also must find ways to keep its economic engine moving forward.

The Yuan’s Wild Ride So Far

In the early 1980s, the Chinese began to implement ‘Socialism with Chinese characteristics’, by opening up the state-controlled economy to the global market in very limited ways.

Since being on the world stage, the yuan has been all over the place. It’s been pegged to the U.S. dollar, unpegged, and then temporarily re-pegged again during the Financial Crisis.

Most recently, the currency was devalued sharply in 2015 to make up for slowing GDP growth. Today, it sits at six-year lows against the U.S. dollar.

The PBOC and the Chinese Yuan

The strategy used by The People’s Bank of China has not been easy to follow.

China wants its currency to matter, but it is also guilty of intervening in currency markets according to the priorities of the day.

In September 2016, for example, the country increased overnight borrowing rates and bought up the yuan in large amounts to counteract shorting from international traders.

The Fix Is In

Onshore, the yuan is allowed to trade within 2% of the PBOC reference point.

The previous day’s trading might be a factor in setting this. Then again, it may not matter. The decision is not up to the market. Value is set by unnamed officials behind the scenes.

This “flexibility” allows China to swing between different strategies for the yuan.

The Dragon’s Gambit

China can print money endlessly to keep the yuan’s value artificially low, which is good for manufacturers. This is handy in a case such as when exports fall year-over-year, and the economy is slowing.

But in other cases, China has different priorities, such as protecting the value of the yuan during times of international uncertainty. It can help to do this by securing the yuan with surprise gold holdings announcements or by dumping massive amounts of U.S. Treasuries to prop up the yuan’s price.

Sometimes these divergent strategies appear to be operating in the same week. Who’s in charge?

International currency traders ultimately don’t know how these decisions are made, or who is making them.

The Golden Hoard That Wasn’t

China’s currency manipulation has helped it to accumulate massive foreign exchange holdings. But these holdings are not a sign of economic strength or a basis for investment in the country’s future. They’re a hedge against currency flight. When the economy is sinking, the government can use these reserves to prop it back up.

RankCountryOfficial Reserve Assets (billions of USD)
1China$3,520.4
2Japan$1,321.0
3Euro Area$819.9
4Switzerland$661.2
5Saudi Arabia$580.7
6Russia$407.3
7Hong Kong$380.2
8Rep. Korea$372.6
9India$366.2
10Brazil$362.2

The Dragon Sleeps

According to the Bank of International Settlements, trading volume of the Chinese yuan has doubled over the last three years.

But the U.S. greenback and other top currencies have a huge advantage: people think they know what they are worth. The value isn’t set by government apparatchik.

For now, the Chinese yuan remains a sleeping dragon. If China ever really joins the global market in a meaningful way, watch the currency wake up and breathe fire.

Get a free Beginner's Guide to Buying Precious Metals

Embed This Image On Your Site (copy code below):

The Money Project is an ongoing collaboration between Visual Capitalist and Texas Precious Metals that seeks to use intuitive visualizations to explore the origins, nature, and use of money.

How Much Money Have Humans Created?

The dollar amounts are so staggering, that simply telling you how much money humans have created probably wouldn’t convey the magnitude.

However, by using data visualization in this video, we can relate numbers in the millions, billions, and trillions to create the context to make it more understandable.

Starting With Context

The median U.S. household income of $54,000 is a number that most people can relate to. It’s enough money to save up to buy a car, or maybe even a house depending on where you live.

Multiply that income by eight, and that number is now big enough to count as being in the top 1% of earners. People in the “one percent” make at least $430,000 per year.

Famous celebrities and businesspeople have fortunes that dwarf those of many “one percenters”. Actor George Clooney, for example, has a net worth of $180 million. Meanwhile, author J.K. Rowling is estimated to have a net worth of roughly $1 billion according to Forbes.

Zuckerberg takes things to a whole new level. His net worth worth is $53 billion, thanks to the value of Facebook stock. Lastly, Bill Gates regularly tops the “richest people” lists with a wealth of $75 billion – though lately that number has been a little higher based on stock fluctuations.

However, even the wealth of the richest human on Earth is not enough to get up to our unit of measurement that we use in the video: each square is equal to $100 billion.

The World’s Money

Some of the world’s biggest companies take up just a few squares with our unit of measurement. ExxonMobil for example has a market capitalization of about $350 billion, and the world’s largest public company by market capitalization, Apple, is at about $600 billion.

The total of the world’s physical currency – all coins and bills denominated in dollars, euros, yen, and other currencies – is about $5 trillion.

Meanwhile, if we add checking accounts to the equation, the number for the amount of money in the world goes up to $28.6 trillion according to the CIA World Factbook. This is called “narrow money”.

Add all money market, savings, and time deposits, and the number jumps up to $80.9 trillion – or “broad money”.

But that’s nothing compared to the world of Wall Street.

Wall Street

All stock markets added together are worth $70 trillion, and global debt is $199 trillion.

That’s all impressive, but the derivatives market takes the cake. Derivatives are contracts between parties that derive value from the performance of underlying assets, indices, or entities. On the low end, the notional value of the derivatives market is estimated to be a whopping $630 trillion according to the Bank of International Settlements.

However, that only accounts for OTC (over-the-counter) derivatives, and the truth is that no one actually knows the size of the derivatives market. It’s been estimated by some that it could be as high as $1.2 quadrillion, and others estimate it could be even higher.

There are many financial critics who worry about the risk that these contracts pile onto the global financial system. With the sheer size of the derivative market dwarfing all others, it’s understandable why business mogul Warren Buffett has called derivatives “financial weapons of mass destruction”.

About the Money Project

The Money Project aims to use intuitive visualizations to explore ideas around the very concept of money itself. Founded in 2015 by Visual Capitalist and Texas Precious Metals, the Money Project will look at the evolving nature of money, and will try to answer the difficult questions that prevent us from truly understanding the role that money plays in finance, investments, and accumulating wealth.

Presented by: Texas Precious Metals

Visualizing the Size of the U.S. National Debt

Visualizing the Size of the U.S. National Debt

The Money Project is an ongoing collaboration between Visual Capitalist and Texas Precious Metals that seeks to use intuitive visualizations to explore the origins, nature, and use of money.

When numbers get into the billions or trillions, they start to lose context.

The U.S. national debt is one of those numbers. It currently sits at $19.5 trillion, which is actually such a large number that it is truly difficult for the average person to comprehend.

How big is the U.S. National Debt?

The best way to understand these large numbers? We believe it is to represent them visually, by plotting the data with comparable numbers that are easier to grasp.

Today’s data visualization plots the U.S. National Debt against everything from the assets managed by the world’s largest money managers, to the annual value of gold production.

1. The U.S. national debt is larger than the 500 largest public companies in America.
The S&P 500 is a stock market index that tracks the value of the 500 largest U.S. companies by market capitalization. It includes giant companies like Apple, Exxon Mobil, Microsoft, Alphabet, Facebook, Johnson & Johnson, and many others. In summer of 2016, the value of all of these 500 companies together added to $19.1 trillion – just short of the debt total.

2. The U.S. national debt is larger than all assets managed by the world’s top seven money managers.
The world’s largest money managers – companies like Blackrock, Vanguard, or Fidelity – manage trillions of investor assets in stocks, bonds, mutual funds, ETFs, and more. However, if we take the top seven of these companies and add all of their assets under management (AUM) together, it adds up to only $18.9 trillion.

3. The U.S. national debt is 25x larger than all global oil exports in 2015.
Yes, countries such as Saudi Arabia, Kuwait, and Russia make a killing off of selling their oil around the world. However, the numbers behind these exports are paltry in comparison to the debt. For example, you’d need the Saudis to donate the next 146 years of revenue from their oil exports to fully pay down the debt.

4. The U.S. national debt is 155x larger than all gold mined globally in a year.
Gold has symbolized money and wealth for a long time – but even the world’s annual production of roughly 3,000 tonnes (96 million oz) of the yellow metal barely puts a dent in the debt total. At market prices today, you’d need to somehow mine 155 years worth of gold at today’s rate to equal the debt.

5. In fact, the national debt is larger than all of the world’s physical currency, gold, silver, and bitcoin combined.
That’s right, if you rounded up every single dollar, euro, yen, pound, yuan, and any other global physical currency note or coin in existence, it only amounts to a measly $5 trillion. Adding the world’s physical gold ($7.7 trillion), silver ($20 billion), and cryptocurrencies ($11 billion) on top of that, you get to a total of $12.73 trillion. That’s equal to about 65% of the U.S. national debt.

Get a free Beginner's Guide to Buying Precious Metals

Embed This Image On Your Site (copy code below):

Presented by: Texas Precious Metals

Chart: Deaths of Roman Emperors vs. Coinage Debasement

Chart: Deaths of Roman Emperors vs. Coinage Debasement

The Money Project is an ongoing collaboration between Visual Capitalist and Texas Precious Metals that seeks to use intuitive visualizations to explore the origins, nature, and use of money.

Correlation does not necessarily imply causation.

In other words, just because two sets of data may follow a similar pattern, it does not mean there is any direct causal relationship.

However, as we were assembling our previous research on Currency and the Collapse of the Roman Empire, we noticed something that was too uncanny to skip past: during the 113-year stretch of time from 192 to 305 AD, an astonishing amount of Roman emperors (84%) were either brutally murdered or assassinated.

This, of course, was a particularly troubled period for the Romans. During the Crisis of the Third Century (235 to 284 AD) specifically, the combined pressures of invasion, civil war, plague, and economic depression threatened to bring down the Empire.

Coincidentally, during this same time frame, the silver denarius went from having 2.7 grams silver to being “silver” in name only. Base metals such as bronze and copper were added to the silver coins to debase the currency, and by the year 300 AD, a silver denarius (or its equivalent) had only a trace of silver left.

Notes on the Data

Data on Roman Emperor deaths is from this resource, and the debasement of silver coinage was previously covered by Armstrong Economics.

Roman Emperor deaths or abdications included in the visualization are ones that occurred between the birth of the Empire (27 BC) to the fall of the Western Roman Empire (476 AD). It’s also worth noting that, according to the source, there is a significant amount of emperors who had fates that are unclear or died under mysterious circumstances, and therefore the list may not be entirely accurate.

About the Money Project

The Money Project aims to use intuitive visualizations to explore ideas around the very concept of money itself. Founded in 2015 by Visual Capitalist and Texas Precious Metals, the Money Project will look at the evolving nature of money, and will try to answer the difficult questions that prevent us from truly understanding the role that money plays in finance, investments, and accumulating wealth.

Presented by:

Also From The Money Project:

Currency and the Collapse of the Roman Empire

The World's Most Famous Case of Hyperinflation

Embed This Image On Your Site (copy code below):

Currency and the Collapse of the Roman Empire

Currency and the Collapse of the Roman Empire

The Money Project is an ongoing collaboration between Visual Capitalist and Texas Precious Metals that seeks to use intuitive visualizations to explore the origins, nature, and use of money.

At its peak, the Roman Empire held up to 130 million people over a span of 1.5 million square miles.

Rome had conquered much of the known world. The Empire built 50,000 miles of roads, as well as many aqueducts, amphitheatres, and other works that are still in use today.

Our alphabet, calendar, languages, literature, and architecture borrow much from the Romans. Even concepts of Roman justice still stand tall, such as being “innocent until proven guilty”.

How could such a powerful empire collapse?

The Roman Economy

Trade was vital to Rome. It was trade that allowed a wide variety of goods to be imported into its borders: beef, grains, glassware, iron, lead, leather, marble, olive oil, perfumes, purple dye, silk, silver, spices, timber, tin and wine.

Trade generated vast wealth for the citizens of Rome. However, the city of Rome itself had only 1 million people, and costs kept rising as the empire became larger.

Administrative, logistical, and military costs kept adding up, and the Empire found creative new ways to pay for things.

Along with other factors, this led to hyperinflation, a fractured economy, localization of trade, heavy taxes, and a financial crisis that crippled Rome.

Roman Debasement

The major silver coin used during the first 220 years of the empire was the denarius.

This coin, between the size of a modern nickel and dime, was worth approximately a day’s wages for a skilled laborer or craftsman. During the first days of the Empire, these coins were of high purity, holding about 4.5 grams of pure silver.

However, with a finite supply of silver and gold entering the empire, Roman spending was limited by the amount of denarii that could be minted.

This made financing the pet-projects of emperors challenging. How was the newest war, thermae, palace, or circus to be paid for?

Roman officials found a way to work around this. By decreasing the purity of their coinage, they were able to make more “silver” coins with the same face value. With more coins in circulation, the government could spend more. And so, the content of silver dropped over the years.

By the time of Marcus Aurelius, the denarius was only about 75% silver. Caracalla tried a different method of debasement. He introduced the “double denarius”, which was worth 2x the denarius in face value. However, it had only the weight of 1.5 denarii. By the time of Gallienus, the coins had barely 5% silver. Each coin was a bronze core with a thin coating of silver. The shine quickly wore off to reveal the poor quality underneath.

The Consequences

The real effects of debasement took time to materialize.

Adding more coins of poorer quality into circulation did not help increase prosperity – it just transferred wealth away from the people, and it meant that more coins were needed to pay for goods and services.

At times, there was runaway inflation in the empire. For example, soldiers demanded far higher wages as the quality of coins diminished.

“Nobody should have any money but I, so that I may bestow it upon the soldiers.” – Caracalla, who raised soldiers pay by 50% near 210 AD.

By 265 AD, when there was only 0.5% silver left in a denarius, prices skyrocketed 1,000% across the Roman Empire.
Only barbarian mercenaries were to be paid in gold.

The Effects

With soaring logistical and admin costs and no precious metals left to plunder from enemies, the Romans levied more and more taxes against the people to sustain the Empire.

Hyperinflation, soaring taxes, and worthless money created a trifecta that dissolved much of Rome’s trade.
The economy was paralyzed.

By the end of the 3rd century, any trade that was left was mostly local, using inefficient barter methods instead of any meaningful medium of exchange.

The Collapse

During the crisis of the 3rd century (235-284 A.D), there may have been more than 50 emperors. Most of these were murdered, assassinated, or killed in battle.

The empire was in a free-for-all, and it split into three separate states.

Constant civil wars meant the Empire’s borders were vulnerable. Trade networks were disintegrated and such activities became too dangerous.

Barbarian invasions came in from every direction. Plague was rampant.

And so the Western Roman Empire would cease to exist by 476 A.D.

About the Money Project

The Money Project aims to use intuitive visualizations to explore ideas around the very concept of money itself. Founded in 2015 by Visual Capitalist and Texas Precious Metals, the Money Project will look at the evolving nature of money, and will try to answer the difficult questions that prevent us from truly understanding the role that money plays in finance, investments, and accumulating wealth.

Embed This Image On Your Site (copy code below):

The World's Most Famous Case of Hyperinflation (Part 2 of 2)

The World’s Most Famous Case of Hyperinflation (Part 2)

The Money Project is an ongoing collaboration between Visual Capitalist and Texas Precious Metals that seeks to use intuitive visualizations to explore the origins, nature, and use of money.

For the first infographic in this series, which summarizes the circumstances leading up to hyperinflation in Germany in 1921-1924, it can be found here: Hyperinflation (Part 1 of 2)

Slippery Slope

“Inflation took the basic law-and-order principles of loyalty and trust to the extreme.” Martin Geyer, Historian.

“As things stand, the only way to finance the cost of fighting the war is to shift the burden into the future through loans.” Karl Helfferich, an economist in 1915.

“There is a point at which printing money affects purchasing power by causing inflation.” Eduard Bernstein, socialist in 1918.

In the two years past World War I, the German government added to the monetary base of the Papiermark by printing money. Economic historian Carl-Ludwig Holtfrerich said that the “lubricant of inflation” helped breathe new life into the private sector.

The mark was trading for a low value against the dollar, sterling and the French franc and this helped to boost exports. Industrial output increased by 20% a year, unemployment fell to below 1 percent in 1922, and real wages rose significantly.

Then, suddenly this “lubricant” turned into a slippery slope: at its most severe, the monthly rate of inflation reached 3.25 billion percent, equivalent to prices doubling every 49 hours.

When did the “lubricant” of inflation turn into a toxic hyperinflationary spiral?

The ultimate trigger for German hyperinflation was the loss of trust in the government’s policy and debt. Foreign markets refused to buy German debt or Papiermarks, the exchange rate depreciated, and the rate of inflation accelerated.

The Effects

Hyperinflation in Germany left millions of hard-working savers with nothing left.

Over the course of months, what was enough money to start a stable retirement fund was no longer enough to buy even a loaf of bread.

Who was affected?

  • The middle class – or Mittelstand – saw the value of their cash savings wiped out before their eyes.
  • Wealth was transferred from general public to the government, which issued the money.
  • Borrowers gained at the expense of lenders.
  • Renters gained at the expense of property owners (In Germany’s case, rent ceilings did not keep pace with general price levels)
  • The efficiency of the economy suffered, as people preferred to barter.
  • People preferred to hold onto hard assets (commodities, gold, land) rather than paper money, which continually lost value.

Stories of Hyperinflation

During the peak of hyperinflation, workers were often paid twice a day. Workers would shop at midday to make sure their money didn’t lose more value. People burned paper bills in the stove, as they were cheaper than wood or other fuel.

Here some of the stories of ordinary Germans during the world’s most famous case of hyperinflation.

  • “The price of tram rides and beef, theater tickets and school, newspapers and haircuts, sugar and bacon, is going up every week,” Eugeni Xammar, a journalist, wrote in February 1923. “As a result no one knows how long their money will last, and people are living in constant fear, thinking of nothing but eating and drinking, buying and selling.”
  • A man who drank two cups of coffee at 5,000 marks each was presented with a bill for 14,000 marks. When he asked about the large bill, he was told he should have ordered the coffees at the same time because the price had gone up in between cups.
  • A young couple took a few hundred million marks to the theater box office hoping to see a show, but discovered it wasn’t nearly enough. Tickets were now a billion marks each.
  • Historian Golo Mann wrote: “The effect of the devaluation of the German currency was like that of a second revolution, the first being the war and its immediate aftermath,” he concluded. Mann said deep-seated faith was being destroyed and replaced by fear and cynicism. “What was there to trust, who could you rely on if such were even possible?” he asked.

Even Worse Cases of Hyperinflation

While the German hyperinflation from 1921-1924 is the most known – it was not the worst episode in history.

In mid-1946, prices in Hungary doubled every fifteen hours, giving an inflation rate of 41.9 quintillion percent. By July 1946, the 1931 gold pengõ was worth 130 trillion paper pengõs.

Peak Inflation Rates:
Germany (1923): 3.5 billion percent
Zimbabwe (2008): 79.6 billion percent
Hungary (1946): 41.9 quintillion percent

Hyperinflation has been surprisingly common in the 20th century, happening many dozens of times throughout the world. It continues to happen even today in countries such as Venezuela.

What would become of Germany after its bout of hyperinflation?

A young man named Adolf Hitler began to grow angry that innocent Germans were starving…

“We are opposed to swarms of Americans and other foreigners raising prices throughout Germany while millions of Germans are starving because of the increased prices. We are equally opposed to German profiteers and we are demanding that all be imprisoned.” – Adolf Hitler, 1923, Chicago Tribune

About the Money Project

The Money Project aims to use intuitive visualizations to explore ideas around the very concept of money itself. Founded in 2015 by Visual Capitalist and Texas Precious Metals, the Money Project will look at the evolving nature of money, and will try to answer the difficult questions that prevent us from truly understanding the role that money plays in finance, investments, and accumulating wealth.

Embed This Image On Your Site (copy code below):

The World's Most Famous Case of Hyperinflation (Part 1 of 2)

The World’s Most Famous Case of Hyperinflation (Part 1)

The Money Project is an ongoing collaboration between Visual Capitalist and Texas Precious Metals that seeks to use intuitive visualizations to explore the origins, nature, and use of money.

Part 2 to this series, discussing the ultimate effects of hyperinflation on the German populous, and other intense cases of hyperinflation, can be found here: Hyperinflation (Part 2 of 2)

The Great War ended on the 11th hour of November 11th, 1918, when the signed armistice came into effect.

Though this peace would signal the end of the war, it would also help lead to a series of further destruction: this time the destruction of wealth and savings.

The world’s most famous hyperinflation event, which took place in Germany from 1921 and 1924, was a financial calamity that led millions of people to have their savings erased.

The Treaty of Versailles

Five years after the assassination of Archduke Franz Ferdinand, the Treaty of Versailles was signed, officially ending the state of war between Germany and the Allies.

The terms of the agreement, which were essentially forced upon Germany, made the country:

  1. Accept blame for the war
  2. Agree to pay £6.6 billion in reparations (equal to $442 billion in USD today)
  3. Forfeit territory in Europe as well as its colonies
  4. Forbid Germany to have submarines or an air force, as well as a limited army and navy
  5. Accept the Rhineland, a strategic area bordering France and other countries, to be fully demilitarized.

“I believe that the campaign for securing out of Germany the general costs of the war was one of the most serious acts of political unwisdom for which our statesmen have ever been responsible.”
– John Maynard Keynes, representative of the British Treasury

Keynes believed the sums being asked of Germany in reparations were many times more than it was possible for Germany to pay. He thought that this could create large amounts of instability with the global financial system.

The Catalysts

1. Germany had suspended the Mark’s convertibility into gold at the beginning of war.

This created two separate versions of the same currency:

Goldmark: The Goldmark refers to the version on the gold standard, with 2790 Mark equal to 1 kg of pure gold. This meant: 1 USD = 4 Goldmarks, £1 = 20.43 Goldmarks

Papiermark: The Papiermark refers to the version printed on paper. These were used to finance the war.
In fear that Germany would run the printing presses, the Allies specified that reparations must be paid in the Goldmarks and raw materials of equivalent value.

2. Heavy Debt

Even before reparations, Germany was already in significant debt. The country had borrowed heavily during the war with expectations that it would be won, leaving the losers repay the loans.

Adding together previous debts with the reparations, debt exceeded Germany’s GDP.

3. Inability to Pay

The burden of payments was high. The country’s economy had been damaged by the war, and the loss of Germany’s richest farmland (West Prussia) and the Saar coalfields did not help either.

Foreign speculators began to lose confidence in Germany’s ability to pay, and started betting against the Mark.

Foreign banks and businesses expected increasingly large amounts of German money in exchange for their own currency. It became very expensive for Germany to buy food and raw materials from other countries.

Germany began mass printing bank notes to buy foreign currency, which was in turn used to pay reparations.

4. Invasion of The Ruhr

After multiple defaults on payments of coal and timber, the Reparation Commission voted to occupy Germany’s most important industrial lands (The Ruhr) to enforce the payment of reparations.

French and Belgian troops invaded in January 1923 and began The Occupation of The Ruhr.

German authorities promoted the spirit of passive resistance, and told workers to “do nothing” to help the invaders. In other words, The Ruhr was in a general strike, and income from one of Germany’s most important industrial areas was gone.

On top of that, more and more banknotes had to be printed to pay striking workers.

Hyperinflation

Just two calendar years after the end of the war, the Papiermark was worth 10% of its original value. By the end of 1923, it took 1 trillion Papiermarks to buy a single Goldmark.

All cash savings had lost their value, and the prudent German middleclass savers were inexplicably punished.
Learn about the effects of German hyperinflation, how it was curtailed, and about other famous hyperinflations in Part 2 (released sometime the week of Jan 18-22, 2016).

About the Money Project

The Money Project aims to use intuitive visualizations to explore ideas around the very concept of money itself. Founded in 2015 by Visual Capitalist and Texas Precious Metals, the Money Project will look at the evolving nature of money, and will try to answer the difficult questions that prevent us from truly understanding the role that money plays in finance, investments, and accumulating wealth.

Embed This Image On Your Site (copy code below):

The World's Strangest Currencies

Infographic: The World’s Strangest Currencies

For centuries, humans from all around the world have tried to use different things as money. Some forms, which most people are familiar with today, have been effective catalysts for trade over thousands of years. Other currencies, from squirrel pelts to parmesan cheese, have had their time or place in human history, but were ultimately unsuccessful or made obsolete.

The path to finding the best money has been long and riddled with trial and error. Here are just some of the world’s strangest currencies that we discovered in our research.

Salt

The importance of salt to ancient civilizations cannot be understated. The first written record on salt appears in 2700 BCE in China.

Salt was highly valued for food preservation, but its production was very limited. As a result, in many places of the world, salt was used as currency.

  • As early as the 6th century, Moorish merchants in sub-Saharan Africa routinely traded salt and gold at the same value per ounce.
  • In what is now modern-day Ethiopia, slabs of rock salt were used as coins. Each coin was 10 inches long and two inches thick.
  • Salt was also used as pay soldiers in Ancient Rome. This became known as “solarium argentum”, from which we now derive the word “salary”
  • A soldier’s salary was cut if he was “not worth his salt”, a phrase that still exists today.

Tea Bricks

Bricks of tea leaves were used for currency in many places in Asia. However, it was the nomads in Mongolia and Siberia that actually preferred tea bricks to metallic coins.

Tea leaves, either whole or ground, would be dried and compressed into bricks using flour, manure, or blood. The bricks could be used as a means of exchange, or they could be eaten, used to make tea, or brewed for medicine.

Parmesan Cheese

In Italy, the hard, dry cheese made from skim milk is not just for pasta. It was also used as a currency.

As early as the year 1200, wheels of parmesan were used as a medium of exchange for other goods.

Even as recent as 2009, the New York Times reported some banks in the region using parmesan wheels as collateral for farmers’ loans. Each compact wheel holds the equivalent of 550 liters of milk.

Rai Stones

In the Solomon Islands, one of the world’s strangest currencies was born: the rai stone. These limestone discs with the hole in the center were up to 12 feet in diameter and weighed up to eight tons.

It was not unusual for buyers and sellers of this currency to have their boats capsize due to their sheer weight.

Animal Skins

Animal skins have a surprisingly important history as currency in different parts of the world.

In Russia and Finland, squirrel pelts were a key medium of exchange during medieval times. Even today, the Finnish word “raha”, which now refers to money, originally meant the “fur of squirrel”.

In North America, the European settlers and First Nations tribes found skins to be one commodity they both agreed had value.

In 1748, Beaver pelts became the “standard of trade” in the north. One pelt could buy two pounds of sugar.

Lastly, the use of buck skins in trade gave rise to “buck” as a slang word for currency, which we still use to describe dollars today.

Knife Money

Merging the ideas of weapons and currency is not new. Many cultures have used arrowheads as currency throughout the world.

However, Chinese “knife money” is certainly an original idea: around 600 BCE, at the time of the Zhou dynasty, these knives were inscribed with numbers or single words such as “sheep” or “fish” to determine their value.

These were used for hundreds of years, and eventually it was declared by the emperor that only circular coins with square holes could be used for Chinese currency.

What Gives a Currency Staying Power?

Currencies come and go.

Some of the world’s strangest currencies, like rai stones, did not have the staying power or value to be used universally. They would eventually fade away into the history books.

Other currencies around the world would experience hyperinflation and ultimately became worthless.

What gives a currency staying power? What makes a currency “money”?

The Money Project acknowledges that the very concept of money itself is in flux – and it seeks to answer these questions.

About the Money Project

The Money Project aims to use intuitive visualizations to explore ideas around the very concept of money itself. Founded in 2015 by Visual Capitalist and Texas Precious Metals, the Money Project will look at the evolving nature of money, and will try to answer the difficult questions that prevent us from truly understanding the role that money plays in finance, investments, and accumulating wealth.

Embed This Image On Your Site (copy code below):

All of the World's Money and Markets in One Visualization

All of the World’s Money and Markets in One Visualization

How much money exists in the world?

Strangely enough, there are multiple answers to this question, and the amount of money that exists changes depending on how we define it. The more abstract definition of money we use, the higher the number is.

In this data visualization of the world’s total money supply, we wanted to not only compare the different definitions of money, but to also show powerful context for this information. That’s why we’ve also added in recognizable benchmarks such as the wealth of the richest people in the world, the market capitalizations of the largest publicly-traded companies, the value of all stock markets, and the total of all global debt.

The end result is a hierarchy of information that ranges from some of the smallest markets (Bitcoin = $5 billion, Silver above-ground stock = $14 billion) to the world’s largest markets (Derivatives on a notional contract basis = somewhere in the range of $630 trillion to $1.2 quadrillion).

In between those benchmarks is the total of the world’s money, depending on how it is defined. This includes the global supply of all coinage and banknotes ($5 trillion), the above-ground gold supply ($7.8 trillion), the narrow money supply ($28.6 trillion), and the broad money supply ($80.9 trillion).

All figures are in the equivalent of US dollars.

About the Money Project

The Money Project acknowledges that the very concept of money itself is in flux – and it seeks to answer these questions.

The Money Project aims to use intuitive visualizations to explore ideas around the very concept of money itself. Founded in 2015 by Visual Capitalist and Texas Precious Metals, the Money Project will look at the evolving nature of money, and will try to answer the difficult questions that prevent us from truly understanding the role that money plays in finance, investments, and accumulating wealth.

Embed This Image On Your Site (copy code below):

What is Money?

Infographic: What is Money?

At first glance, the concept of “money” seems extremely straightforward.

For example: the cost of a loaf of bread in New York City at a grocery store may be $3.50. We don’t think about it much, and we pull out our wallets to pay with cash or a credit card.

But money is actually more complex. A very similar loaf could have been bought for:

  • 0.4 aes during the Roman Republic
  • 3 aes in Rome under Emperor Nero
  • 1 penny during Queen Elizabeth’s reign in England
  • 0.2 beaver pelts in 1795 in North America
  • $0.21 in 1965
  • $35 million Zimbabwean dollars in the midst of hyperinflation
  • 10¥ in China (equal to only $1.50 USD)
  • 35 rubles in Moscow (equal to only ~$0.55 USD)
  • 7.8 grams of silver ($14 spot price)
  • 23,000 Dogecoin cryptocurrency

Time and place clearly matters. However, which “money” you pay with also matters. What is money?

This all creates more questions than it answers:

  • Are all of these above things examples of money?
  • Is money finite or infinite?
  • Where does money come from?
  • Is value constant, or does it change?
  • How much money exists?
  • How does this all affect our wealth and investments?

The Money Project acknowledges that the very concept of money itself is in flux – and it seeks to answer these questions.

About the Money Project

The Money Project aims to use intuitive visualizations to explore ideas around the very concept of money itself. Founded in 2015 by Visual Capitalist and Texas Precious Metals, the Money Project will look at the evolving nature of money, and will try to answer the difficult questions that prevent us from truly understanding the role that money plays in finance, investments, and accumulating wealth.

Embed This Image On Your Site (copy code below):