38 Incredible Facts on the Modern U.S. Dollar

38 Incredible Facts on the Modern U.S. Dollar

The Money Project is an ongoing collaboration between Visual Capitalist and Texas Precious Metals that seeks to use intuitive visualizations to explore the origins, nature, and use of money.

We’ve previously showed you 31 Fascinating Facts About the Dollar’s Early History, which highlighted the history of U.S. currency before the 20th century. This was a very interesting period in which we looked at the money used by the first colonists, the extreme bust of the Continental currency, the era of privately-issued bank notes, and Congress’ emergency issuance of the fiat “greenback” during the Civil War.

However, the modern era of the U.S. dollar is just as interesting. We have it starting in 1913, when the Federal Reserve Act was passed by Woodrow Wilson. Not only did it establish a new central bank, but it also gave the Fed the authority to issue the Federal Reserve Note, which is now the dominant form of U.S. currency both domestically and abroad.

A New Legal Tender

Leading up to the 20th century, there were four main forms of U.S. currency being used:

  • Gold and silver coins
  • Gold and silver certificates
  • Commercial bank notes, issued by private banks and backed by government bonds
  • “Greenbacks”, a fiat currency declared legal by Congress to help fund the Civil War

In 1913, however, the Federal Reserve Note was authorized as U.S. currency. The new notes were supposed to be backed by gold or other “lawful money”, based on the stipulations of the Federal Reserve Act of 1913.

However, this only lasted about 20 years. By the time of the Great Depression, the Fed considered itself to be in a tight spot. It simply did not have enough gold to back all Federal Reserve Notes and Gold Certificates in circulation, and at the same time wanted flexibility with monetary policy to fight deflation and unemployment.

In 1933, the Emergency Banking Act was passed by President Roosevelt, and Executive Order 6102 was also signed. The latter move famously criminalized monetary gold, and ended the gold standard.

After all, if gold can’t be legally owned, it can’t be legally redeemed.

Modern Paper Money

After a brief return to a pseudo gold standard after WWII, Nixon severed all remaining ties between gold and money in 1971. Since then, U.S. money has been purely fiat, and backed by the government rather than any physical commodity or precious metal.

Some facts on today’s paper money:

  • There is $1.54 trillion of U.S. currency in circulation, and 97% of that is Federal Reserve Notes
  • Over two-thirds of all $100 bills are held outside the U.S.
  • Dollar bills can be folded at least 8,000 times, which is 20x more than a normal sheet of paper
  • That’s because dollar bills are made of a special 75% cotton and 25% linen blend, patented by Crane & Co.
  • The U.S. Bureau of Engraving and Printing produces 38 million notes every day, worth $541 million
  • The two facilities, located in Washington, D.C. and Fort Worth, Texas use 9.7 tons of ink per day
  • For 2017, the Fed ordered 7.1 billion new notes, worth $209 billion
  • More than 70% of these notes are used to replace damaged ones
  • Notes with smaller denominations ($1, $5, $10) tend to last for shorter periods of time, due to more frequent usage

Coins

The coins used today are similar to U.S. Federal Reserve Notes in that their face values tend to greatly exceed their intrinsic values.

This is because cheaper metals such as copper, zinc, and nickel are used instead of gold or silver.

  • The average lifespan of a coin is 25 years, according to the U.S. Mint
  • It’s estimated that Americans throw away around $62 million of coins every year
  • In 2016, the U.S. Mint produced 16 trillion coins, valued at over $1.09 billion
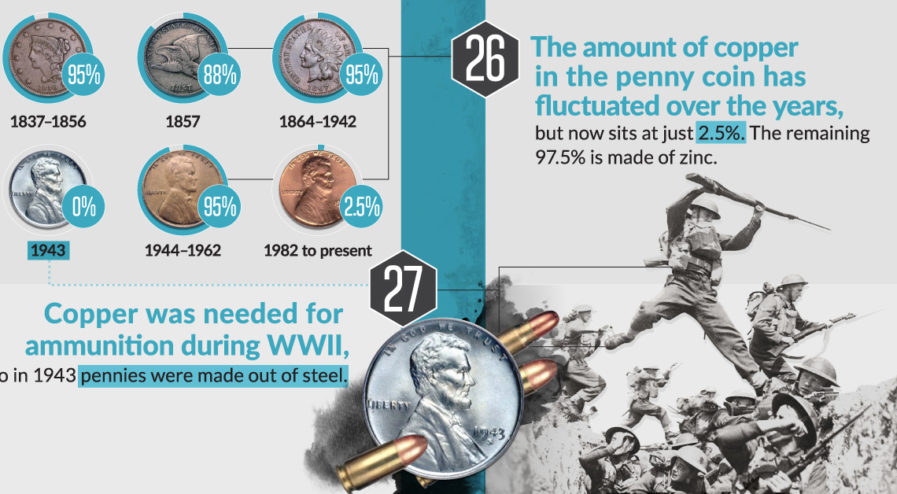
  • The amount of copper in a penny has fluctuated over the years. It ranges from 0% (in WWII, pennies were made of steel so copper could be used for ammunition) to 95%.
  • Today’s pennies are 2.5% copper, with the remainder being 97.5% zinc

Get a free Beginner's Guide to Buying Precious Metals

Embed This Image On Your Site (copy code below):

Presented by: Texas Precious Metals

The Buying Power of the U.S. Dollar Over the Last Century

The Buying Power of the U.S. Dollar Over the Last Century

The Money Project is an ongoing collaboration between Visual Capitalist and Texas Precious Metals that seeks to use intuitive visualizations to explore the origins, nature, and use of money.

The value of money is not static. In the short term, it may ebb and flow against other currencies on the market. In the long-term, a currency tends to lose buying power over time through inflation, and as more currency units are created.

Inflation is a result of too much money chasing too few goods – and it is often influenced by government policies, central banks, and other factors. In this short timeline of monetary history in the 20th century, we look at major events, the change in money supply, and the buying power of the U.S. dollar in each decade.

A Short Timeline of U.S. Monetary History

1900s
After the Panic of 1907, the National Monetary Commission is established to propose legislation to regulate banking.

U.S. Money Supply: $7 billion
What $1 Could Buy: A pair of patent leather shoes.

1910s
The Federal Reserve Act is signed in 1913 by President Woodrow Wilson.

U.S. Money Supply: $13 billion
What $1 Could Buy: A woman’s house dress.

1920s
U.S. dollar bills were reduced in size by 25%, and standardized in terms of design.

The Fed starts using open market operations as a tool for monetary policy.

U.S. Money Supply: $35 billion
What $1 Could Buy: Five pounds of sugar.

1930s
To deal with deflation during the Great Depression, the United States suspends the gold standard. President Franklin D. Roosevelt signs Executive Order 6102, which criminalizes the possession of gold.

By no longer allowing gold to be legally redeemed, this removes a major constraint on the Fed, which can now control the money supply.

U.S. Money Supply: $46 billion
What $1 Could Buy: 16 cans of Campbell’s Soup

1940s
The massive deficits of World War II are almost financed entirely by the creation of new money by the Federal Reserve.

Interest rates are pegged low at the request of the Treasury.

Under Bretton-Woods, the “gold-exchange standard” is adopted.

U.S. Money Supply: $55 billion
What $1 Could Buy: 20 bottles of Coca-Cola

1950s
The Korean War starts in 1950, and inflation is at an annualized rate of 21%.

The Fed can no longer manage such low interest rates, and tells the Treasury that it can “no longer maintain the existing situation”.

U.S. Money Supply: $151 billion
What $1 Could Buy: One Mr. Potato Head

1960s
An agreement, called the Treasury-Federal Reserve Accord, is reached to establish the central bank’s independence.

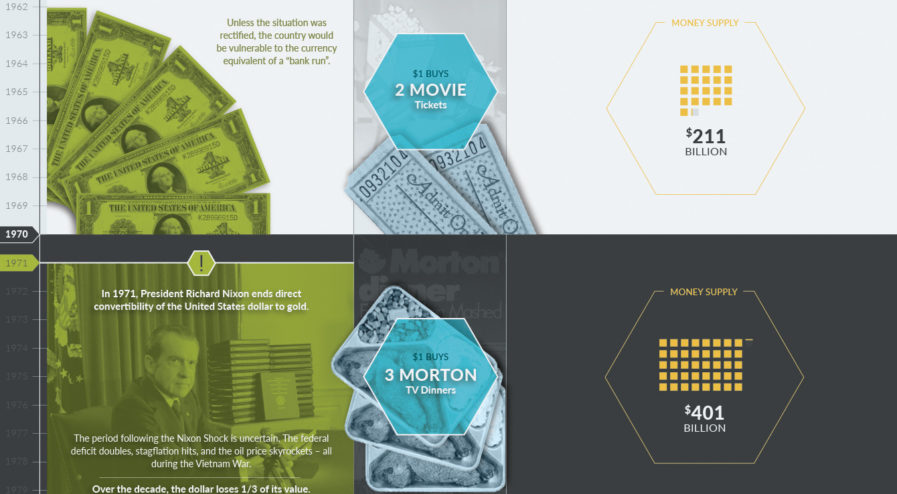
By this time, U.S. dollars in circulation around the world exceeded U.S. gold reserves. Unless the situation was rectified, the country would be vulnerable to the currency equivalent of a “bank run”.

U.S. Money Supply: $211 billion
What $1 Could Buy: Two movie tickets.

1970s
In 1971, President Richard Nixon ends direct convertibility of the United States dollar to gold.

The period following the Nixon Shock is uncertain. The federal deficit doubles, stagflation hits, and the oil price skyrockets – all during the Vietnam War.

Over the decade, the dollar loses 1/3 of its value.

U.S. Money Supply: $401 billion
What $1 Could Buy: Three Morton TV dinners.

1980s
The stock market crashes in 1987 on Black Monday.

The Federal Reserve, under newly-appointed Alan Greenspan, issues the following statement:

“The Federal Reserve, consistent with its responsibilities as the nation’s central bank, affirmed today its readiness to serve as a source of liquidity to support the economic and financial system.”

The Dow would recover by 1989, with no prolonged recession occurring.

U.S. Money Supply: $1,560 billion
What $1 Could Buy: One bottle of Heinz Ketchup.

1990s
This decade is generally considered to be a time of declining inflation and the longest peacetime economic expansion in U.S. history.

During this decade, many improvements are made to U.S. paper currency to prevent counterfeiting. Microprinting, security thread, and other features are used.

U.S. Money Supply: $3,277 billion
What $1 Could Buy: One gallon of milk.

2000s
After the Dotcom crash, the Fed drops interest rates to near all-time lows.

In 2008, the Financial Crisis hits and the Fed begins “quantitative easing”. Later, this would be known as QE1.

U.S. Money Supply: $4,917 billion
What $1 Could Buy: One Wendy’s hamburger.

2010-
After QE1, the Fed holds $2.1 trillion of bank debt, mortgage-backed securities, and Treasury notes. Shortly after, QE2 starts.

In 2012, it’s time for QE3.

Purchases were halted in October 2014 after accumulating $4.5 trillion in assets.

U.S. Money Supply: $13,291 billion
What $1 Could Buy: One song from iTunes.

The Changing Value of a Dollar

At the turn of the 20th century, the money supply was just $7 billion. Today there are literally 1,900X more dollars in existence.

While economic growth has meant we all make many more dollars today, it is still phenomenal to think that during past moments in the 20th century, a dollar could buy a pair of leather shoes or a women’s house dress.

The buying power of a dollar has changed significantly over the last century, but it’s important to recognize that it could change even faster (up or down) under the right economic circumstances.

Get a free Beginner's Guide to Buying Precious Metals

Embed This Image On Your Site (copy code below):
The Money Project is an ongoing collaboration between Visual Capitalist and Texas Precious Metals that seeks to use intuitive visualizations to explore the origins, nature, and use of money.

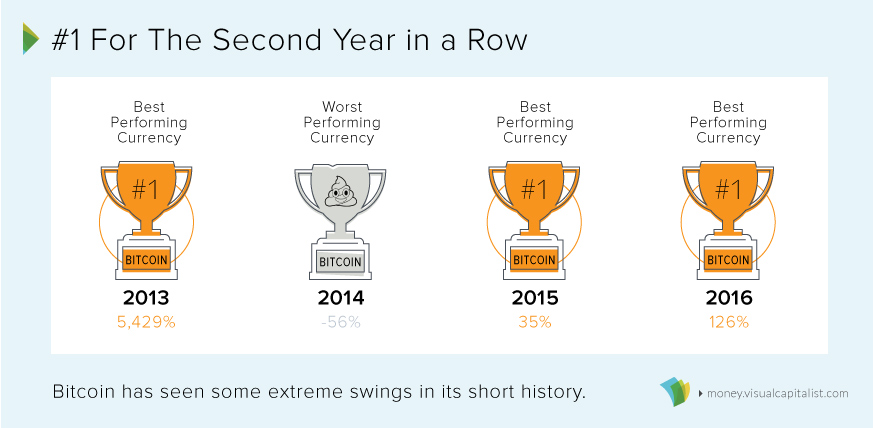
Bitcoin is no stranger to extreme fluctuations.

For each of the last four years, the cryptocurrency has either been the best or the worst performing currency – with nothing to be found in between.

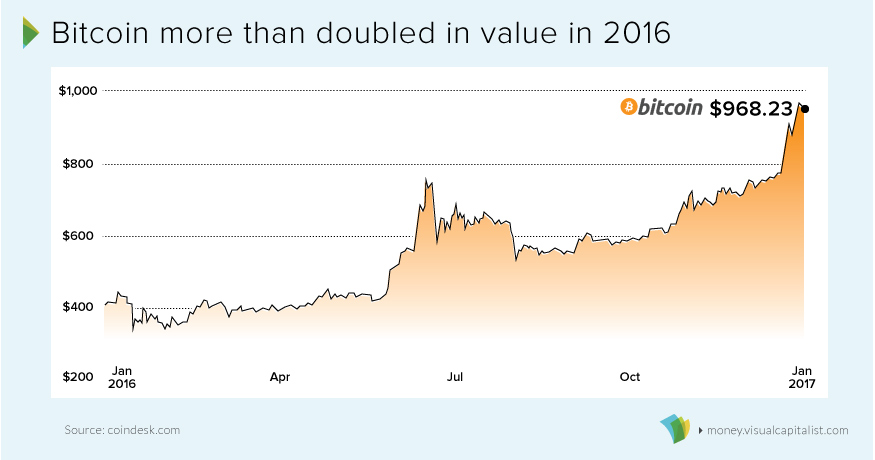
Luckily, for those that follow the digital currency closely, those fluctuations were mostly pointed in an upwards direction for 2016. The currency finished the year at $968.23, which is more than double its value from the beginning of the year.

Bitcoin the best performing currency in 2016

Were any other global currencies able to compete with bitcoin’s strong performance throughout the year?

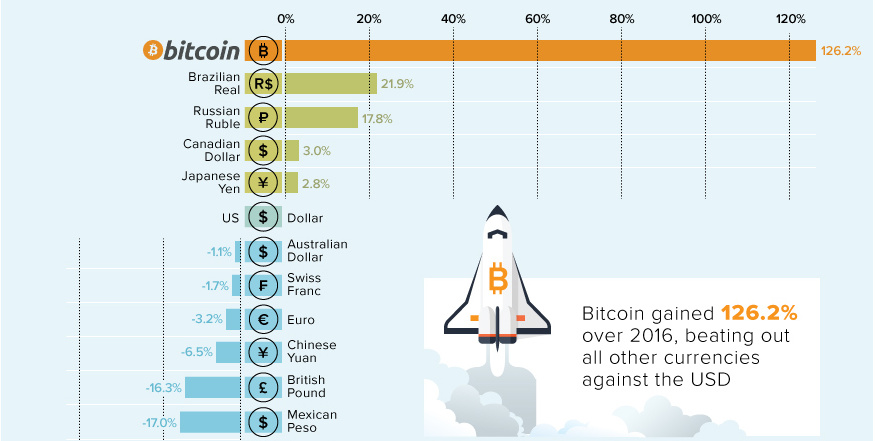
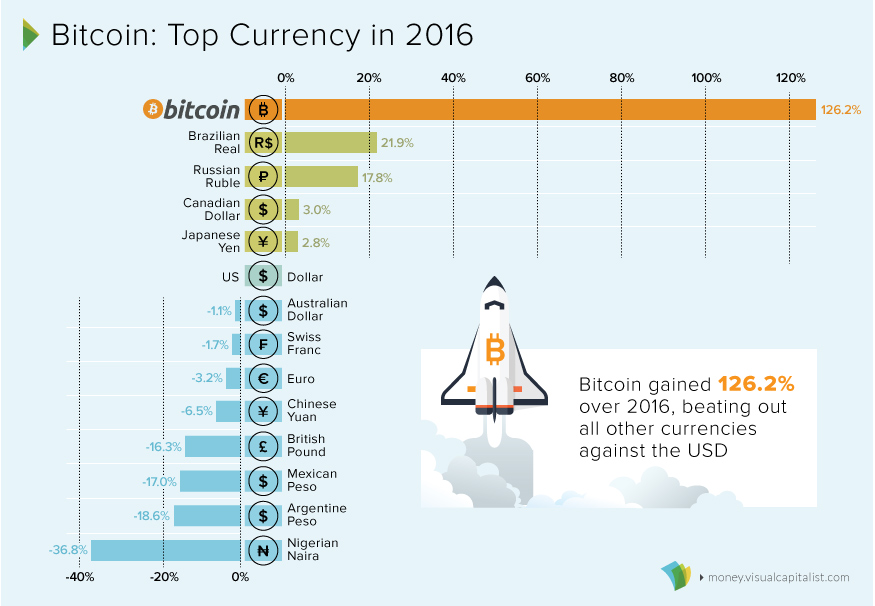
The following chart compares major currencies (paired with the USD) over 2016:

Bitcoin performance vs other currencies

Brazil’s real rallied 21.9% on the year, the most in seven years. Traders are hoping that center-right President Michel Temer can ease public spending following the departure of Dilma Rousseff.

Russia’s ruble also finished the year with double-digit gains, up 17.8% against the U.S. dollar. This was largely due to the recovery in Brent oil prices, which gained $10/bbl over the course of 2016.

However, a rosier picture for oil was not enough to buoy all producers. Africa’s biggest economy, Nigeria, fell into its first recession in 25 years during the opening half of 2016. Ripple effects from low oil prices caused the Nigerian naira to lose more than one-third of its value throughout the year, making it the worst performing currency (at least officially).

Unofficially, Venezuela’s struggling economy has been pushed to the brink by its ongoing currency crisis. The massive hyperinflation is not reflected in official numbers, since the bolívar is technically “pegged” arbitrarily by the government. Based on black market activity, however, experts estimate that the currency ended the year with inflation of roughly 500%.

Bitcoin in 2017?

Bitcoin is now the best performing currency for two years in a row (2015, 2016):

Bitcoin has been the top performer 3 of 4 years

And in the opening days of 2017, the cryptocurrency has already gained a head start on other global currencies. It passed the vital $1,000 mark in the first days of New Year trading, and could be poised to three-peat for the title of best-performing currency of the year.

To do it again, bitcoin prices would likely need to rise at least 30% on the year, closing in on the $1,300 mark.

Will it be another extreme for 2017 – or will the bitcoin price finally settle for middle ground among other global currencies?